Sia Load Test Result 2: Real Data Scenario
Last month, I announced the first ever load test of Sia. The load test consists of three distinct test cases:
- Worst-case scenario (published 2018-03-15)
- Real data scenario (this report)
- Best-case scenario (published 2018-04-12)
In this test, I used Sia to solve a real-world problem: storing my DVD collection in the cloud.
This is an exciting test because it measures Sia’s performance at storing real files rather than synthetic, dummy data.
Results summary
| Metric | Value |
|---|---|
| Total uploaded | 4.3 TiB (file bytes) 15.4 TiB (absolute bytes) |
| Storage efficiency | 28.3% |
| Total files uploaded | 2,626 |
| Total file contracts created | 62 |
| Total spent | 4377.1 SC $61.07* USD |
| $ per TB/month | $4.51** |
| Total test time | 231.7 hours (9.7 days) |
| Average upload bandwidth | 45.8 Mbps (file data) 162.1 Mbps (absolute) |
| Sia crashes | 0 |
| Sia version | 1.3.1 |
| Test OS | Win10 x64 |
* Based on Siacoin value at test start (1.3951 cents per SC). Assumes that unused renter funds will successfully return to the test wallet at the conclusion of the renter contracts.
**Assumes that a standard renter contract lasts 2.77 months. Excludes bandwidth costs.
File bytes vs. absolute bytes
(feel free to skip this if you read this in the previous report)
On traditional cloud storage providers like Amazon S3 or Google Cloud Storage, there is a 1:1 ratio between the size of your files and the amount of data for which you are billed. If you upload 100 GiB of files, you pay for 100 GiB of upload bandwidth and for 100 GiB of storage space.
Sia’s costs are more complicated. If you upload 100 GiB of files, the best you can hope for is to pay for 300 GiB in bandwidth and storage (due to Sia’s 3x replication). In practice, the cost is not easily predictable, as it depends on how efficiently Sia repackages your files and how reliable your hosts are.
To keep the semantics clear, I introduce two terms for distinguishing between these metrics:
File bytes is the total number of bytes in files uploaded to Sia.
Absolute bytes is the total amount of data uploaded to hosts, including Sia metadata, file padding, and redundant copies of the data.
If you upload a 100 GiB file and it causes to Sia upload 350 GiB to hosts, that represents a 100 GiB increase in file bytes and a 350 GiB increase in absolute bytes.
File data bandwidth vs. absolute bandwidth
(feel free to skip this if you read this in the previous report)
Because of the distinction between file bytes and absolute bytes, a similar disambiguation is required for bandwidth. In this report, I distinguish between file data bandwidth and absolute bandwidth.
The simplest way to explain them is through an example:
- User uploads a 500 MB file to Sia.
- Sia breaks this file into 12 equally-sized chunks of ~42 MB each, totaling ~504 MB.
- Sia uploads each chunk to three different hosts.
- All uploads complete after 40 seconds.
The file data bandwidth is simply the size of the file divided by the upload duration:
= 500 MB / 40 seconds
= 4000 Mb / 40 seconds
= 100 Mbps
The absolute bandwidth is the total amount of data transferred divided by the upload duration:
= ((42 MB * 12 chunks) * 3 hosts) / 40 seconds
= ((504 MB) * 3 hosts) / 40 seconds
= 1512 MB / 40 seconds
= 12096 Mb / 40 seconds
= 302.4 Mbps
File data bandwidth is what matters
If you have 50 TiB of data to upload to Sia, and you want to know how long this will take, that’s the file data bandwidth.
The absolute data bandwidth is useful to guide Sia developers in designing their upload algorithms, but it is not directly relevant to users.
In this report, I focus on file data bandwidth.
Input data
I still buy Blu-rays and DVDs. I may be the last person on earth who’s doing this, but I still buy them.
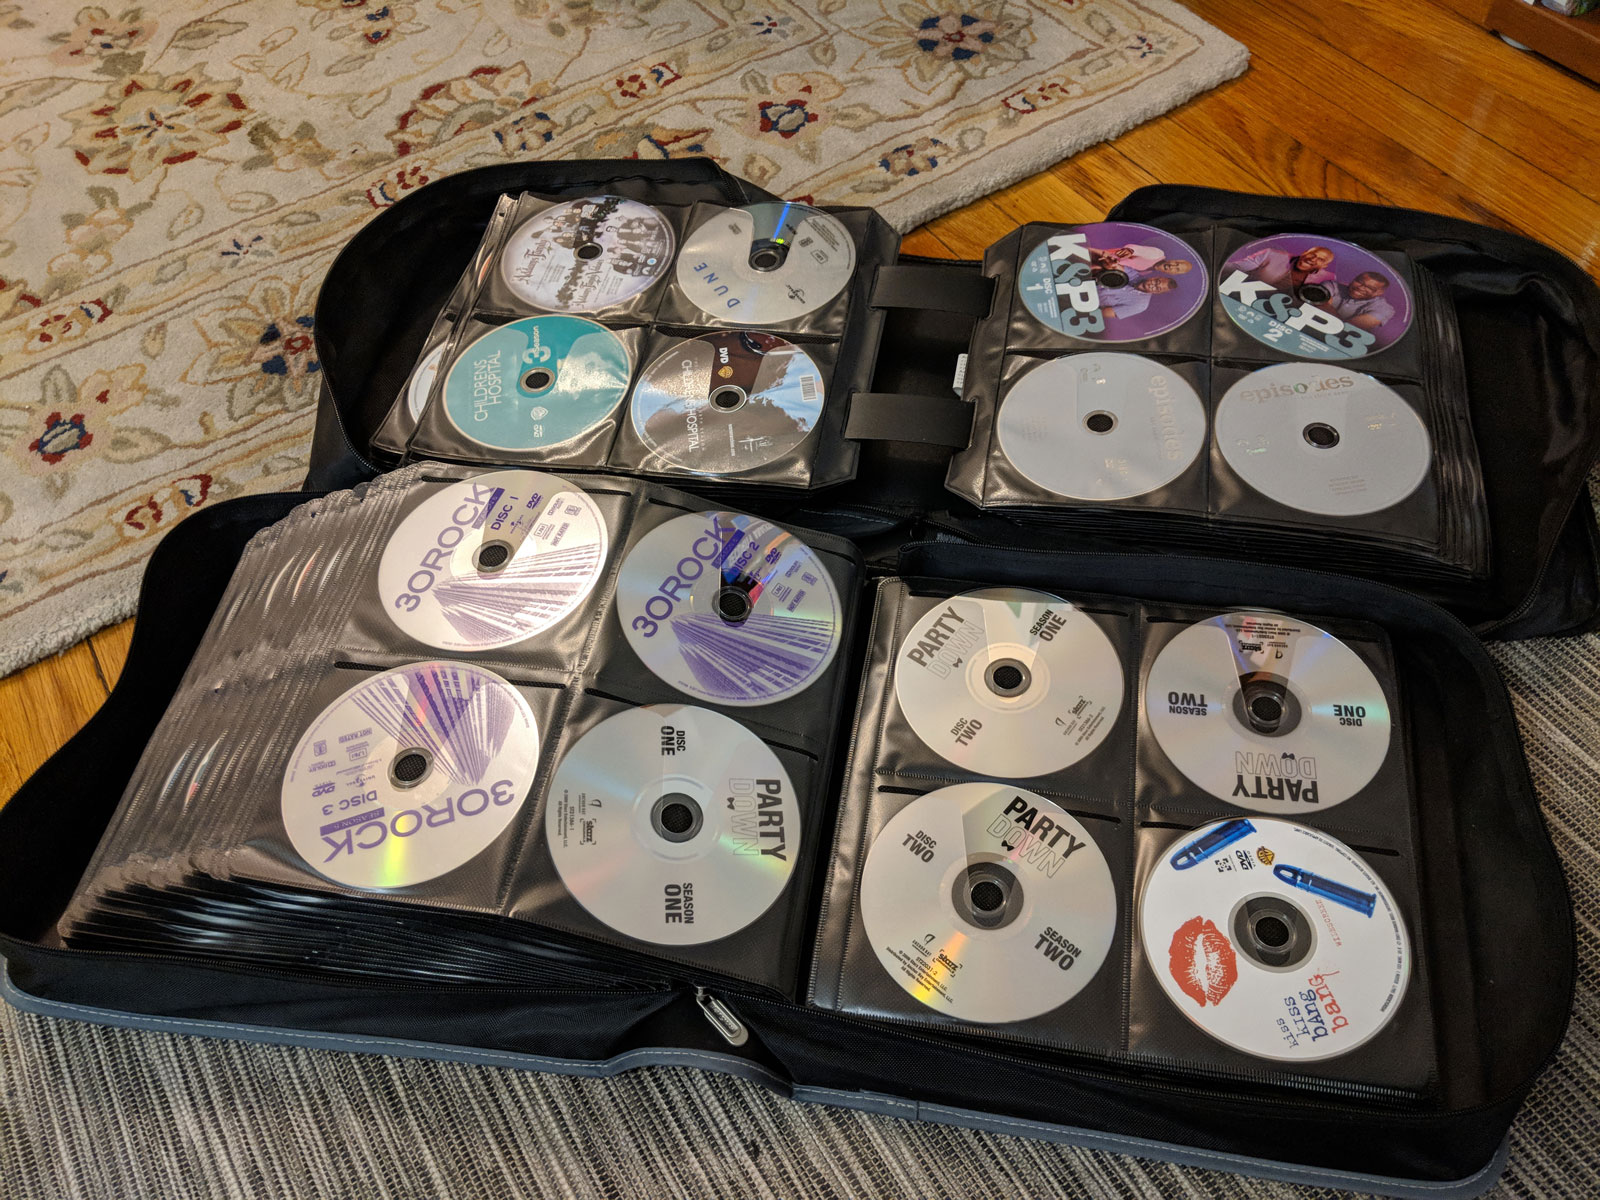
Whenever I buy a new Blu-ray or DVD, I first rip it to a raw ISO image, then use Handbrake to encode it to mp4 so that Plex can stream it to my TV. I keep all the files on my 10 TiB NAS.
Both the raw ISOs and encoded mp4s are large, so this seemed like an ideal data set to test Sia. In total, I have 4.4 TiB of ISOs and mp4s.
This is a realistic test of Sia because I would like to back up these files, but existing storage providers are prohibitively expensive. Even a low-cost option like AWS Glacier would cost about $20/mo in storage. That doesn’t sound so bad until you consider that if I ever needed to recover from a backup, the cost for bandwidth and data retrieval would be about $450.
If I could store this data on Sia for <$10/mo and recover it for <$50 in bandwidth, I’d strongly consider integrating Sia into my backup plan. Sia does not yet support disaster recovery, so I couldn’t use it for this purpose yet, but I can use this test as a way to estimate costs.
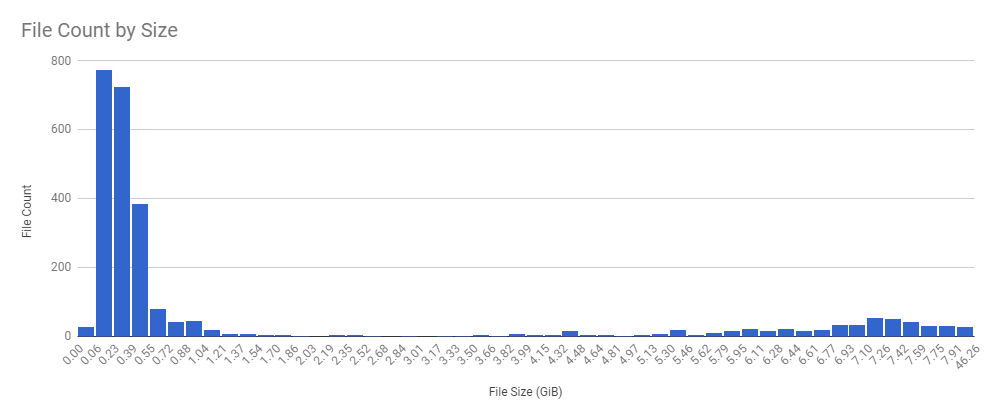
Here are some more details about the files:
| Statistic | Value |
|---|---|
| Minimum file size | 886 bytes |
| Maximum file size | 46.3 GiB |
| Median file size | 343.2 MiB |
| Mean file size | 1.7 GiB |
| Variance | 12.2 GiB |
Of the 2,626 files, 10 were small metadata files (Thumbs.db and such) that slipped in. The vast majority of files were well above Sia’s 40 MiB chunk size.
Storage efficiency
To measure how well Sia stores data, I created the metric of “storage efficiency,” which is simply the file bytes divided by the absolute bytes.
On traditional cloud storage providers, efficiency is 100% because you pay for exactly the size of your files. On Sia, the best possible efficiency is 33.3% because Sia uploads every byte of file data at least three times for redundancy. Other factors can degrade efficiency, such as inefficient repackaging of files or unreliable hosts.
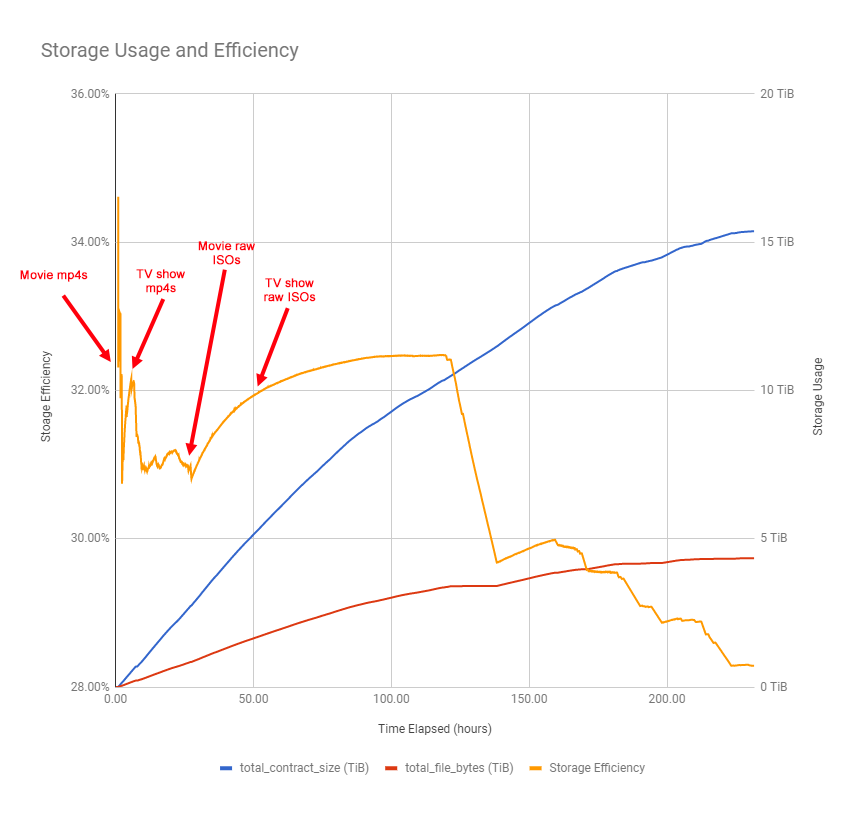
There’s a lot in the graph that’s unexpected to me, so let me start with the part I can explain.
The test started with movie mp4s, which ranged in size from ~400 MiB to ~12 GiB. Recall that Sia divides files into uniform chunks of ~40 MiB. If it uploads a file that’s 400 MiB, this pushes average efficiency closer to 33% because 400 MiB divides evenly into 40 MiB chunks, which yields 1,200 MiB of absolute bytes after 3x redundancy. A file that’s 401 MiB gets rounded up to 440 MiB and generates 1,320 MiB of absolute bytes, which drags efficiency closer to 30.3% (401 MiB / 1,320 MiB). The data naturally contained a mix of files that Sia could divide evenly (increasing efficiency) and those that it could not (decreasing efficiency). This explains the very early spikes as it uploads movie mp4s.
Next, Sia uploaded TV show mp4s, which vary a lot more in size. Episodes of cartoons like The Simpsons can be as small as 31 MiB, while episodes of Saturday Night Live run around 1 GiB. TV show episodes tend to cluster in the 150 to 450 MiB range. The smaller files drove efficiency down, which is reflected in the graph.
Then Sia got to the raw ISO files, which are probably the best match for Sia’s functionality because they’re very large. An extra 40 MiB adds up to 10% waste on a 400 MiB file, but only ~0.5% waste on an 8 GiB file. That explains the smooth upward curve toward 33% shown in the graph when Sia begins uploading ISOs.
Sia stopped uploading new files for 17 hours
The most striking part of the efficiency graph was between the 100- and 150-hour marks, where efficiency took a huge plunge. The graph below zooms in on exactly this portion of the timeline:
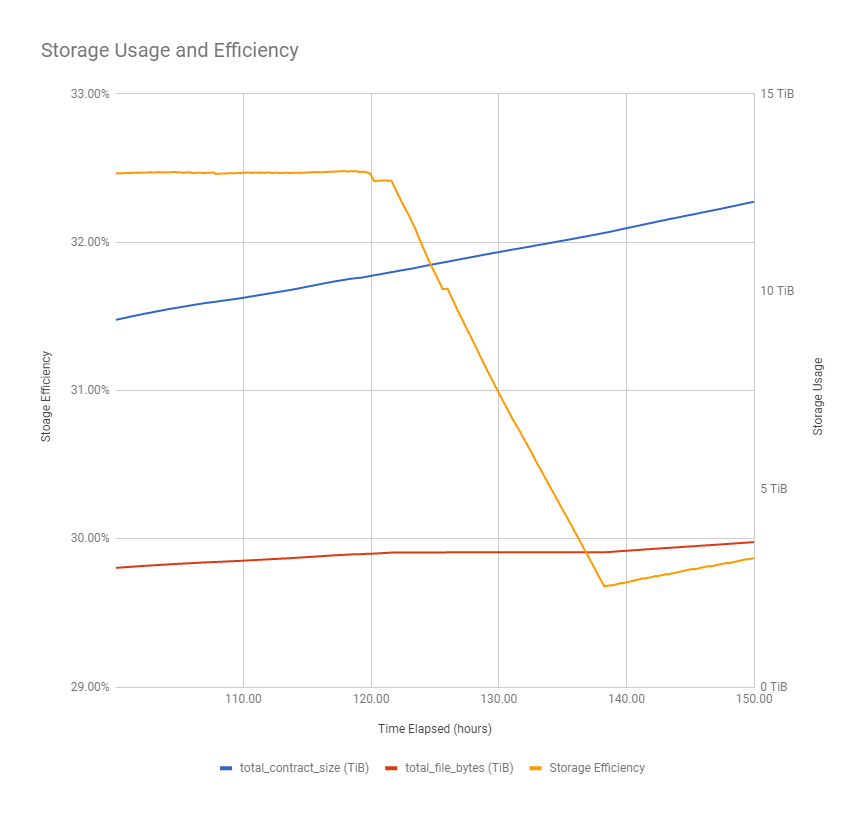
For 17 hours, efficiency goes straight down. This suggests that Sia exclusively repaired existing data instead of uploading new files.
The file data bandwidth graph confirms this, as upload bandwidth dropped to zero for almost the entire period:
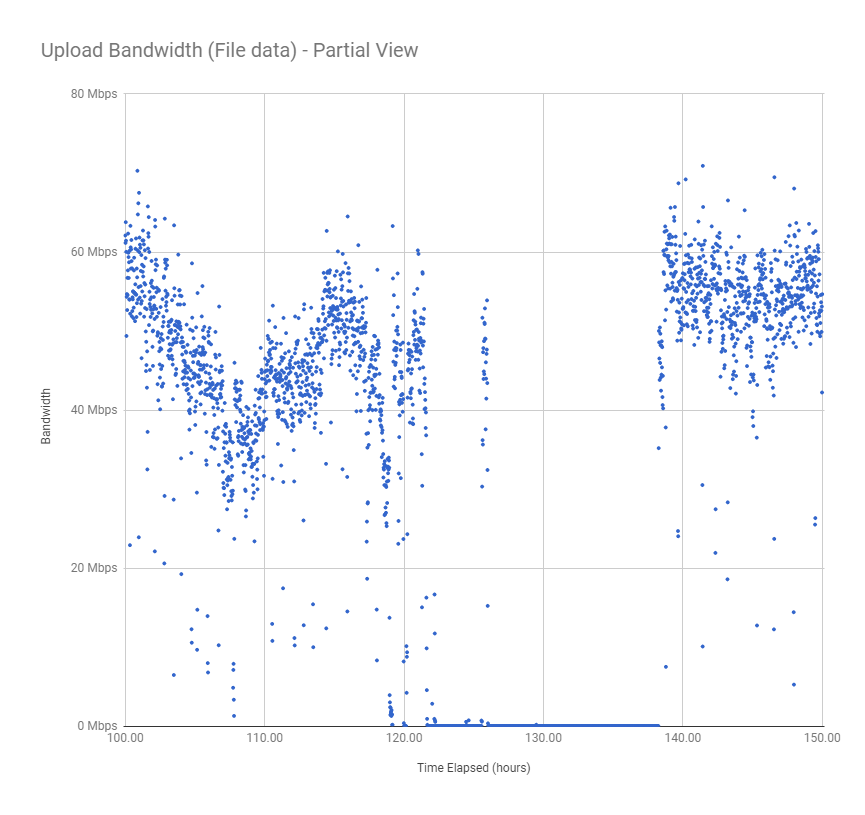
Interestingly, absolute bandwidth did not change significantly during this time:
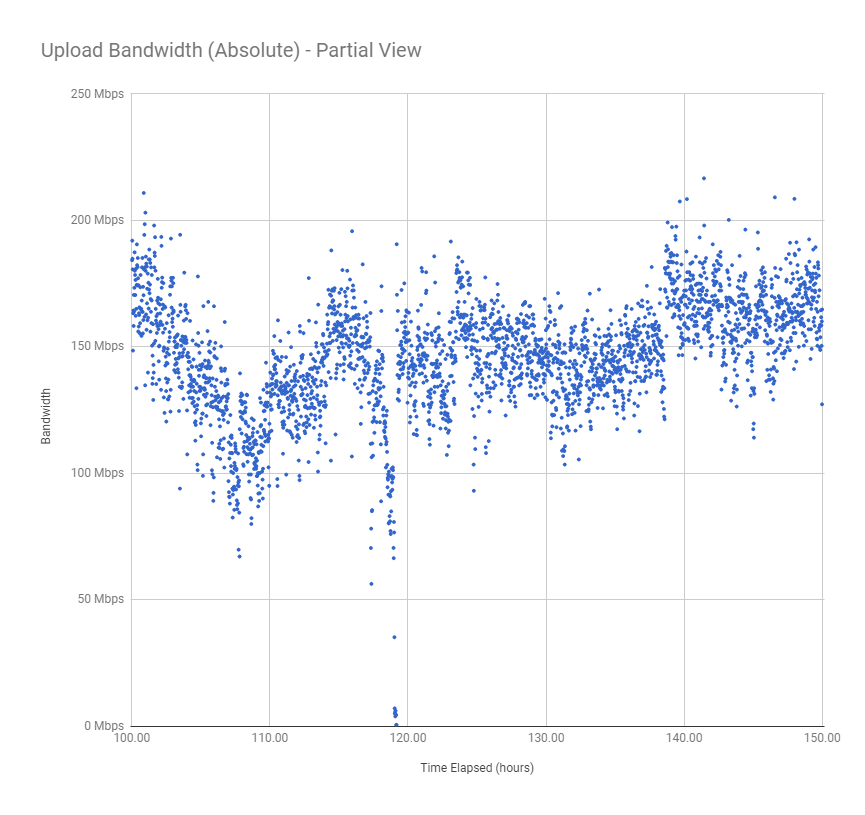
This means that Sia stopped uploading new data and instead just increased redundancy of already uploaded data. But why?
The renter.log file has some interesting messages around that time:
2018/03/12 18:51:36.527796 repairscanner.go:330: Repairing 14254 chunks
2018/03/16 19:13:42.836870 repairscanner.go:330: Repairing 81430 chunks
2018/03/18 12:32:02.565418 repairscanner.go:330: Repairing 91865 chunks
Slightly before the drop, Sia decided to repair 81,430 data chunks. This is the equivalent of repairing 3.1 TiB of absolute bytes. That’s extremely high considering that Sia’s total contract size at the time was 10.5 TiB. It should only need to make a repair of this size if ~1/3 of its hosts went offline all at once.
The other interesting element of the renter log is that Sia made similarly outlandish declarations about repairs on 3/12 and 3/18, but there’s no equivalent efficiency plunges in the graphs on those days.
I don’t have an explanation for what happened with efficiency during this time.
Efficiency never reached equilibrium
I expected efficiency to reach some sort of equilibrium. After enough data is uploaded, the amount of wasted redundancy due to Sia’s 40 MiB data chunking should smooth out and efficiency should approach some average value. That looks like what’s happening between hours 25 and 125 in the graph as it makes that smooth approach to nearly 33%.
Everything after hour 125 baffles me. Efficiency just gets lower and lower, which should only happen if hosts were constantly going offline, but I’m skeptical that host churn was truly that high.
Cost
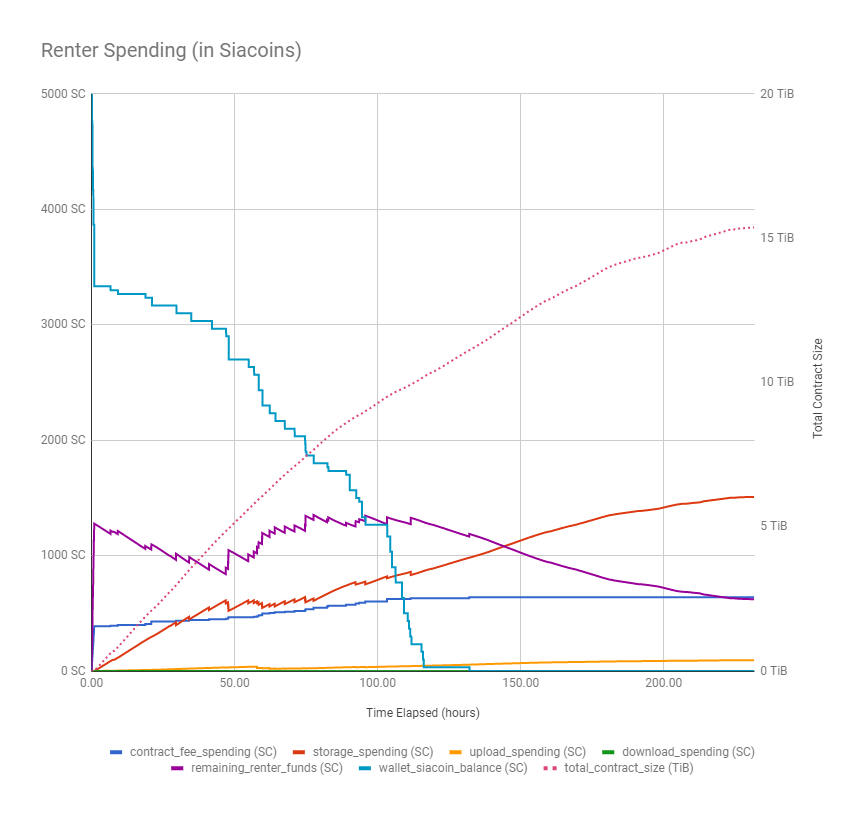
The regularity is striking in this graph. Unlike my previous Sia experiments that showed unexpected spikes or drops, this graph shows clear, intuitive patterns.
Actual storage cost was $4.51 TB/mo
Sia’s standard estimate of storage costs has been $2 per TB/mo for as long as I can remember. It was on the front page of their website until January 2018.

Sia quoted a figure of “$2-3 per TB” on Twitter as recently as three weeks ago.
We are currently at about $2-3 per TB per month. Hosts set their own prices, so Siacoin's valuation does little to affect storage price (hosts are constantly repricing).
— Sia Tech (@SiaTechHQ) February 28, 2018
Google Drive's UI is of course far better, but our goal is to provide a great API for devs to use.
This test showed that the true cost is significantly higher in practice.
To calculate $/TB, I used the following formula:
(
  (
    initial_wallet_balance -
      final_remaining_renter_funds -
      final_upload_bandwidth_spending
  ) / file_data_in_tb
) / months_per_contract
This is a slightly conservative estimate because it assumes that Sia will cease to accrue upload costs after files are initially uploaded. In reality, Sia continues to spend funds on upload bandwidth while sitting idle because it repairs files as hosts go offline. But bandwidth costs were less than $0.10 per TB, so the difference is negligible.
Note that a naïve calculation would be storage_spending / (file_data_in_tb * months_per_contract) but such a calculation would ignore costs from contract fees and bugs in Sia.
48.7% of spending was due to losses from bugs
I’ve replicated bug #2772 in every test I’ve run. This test was no exception.
As Sia spends money from the 5000 SC allocated for this test, the money should move from the Sia wallet into Sia contracts, maintaining a constant sum of 5000 SC. Instead, Sia spent the full 5000 SC from its wallet but only ended up with 2,866.7 SC in contract value, leaving 2,133.3 SC missing.
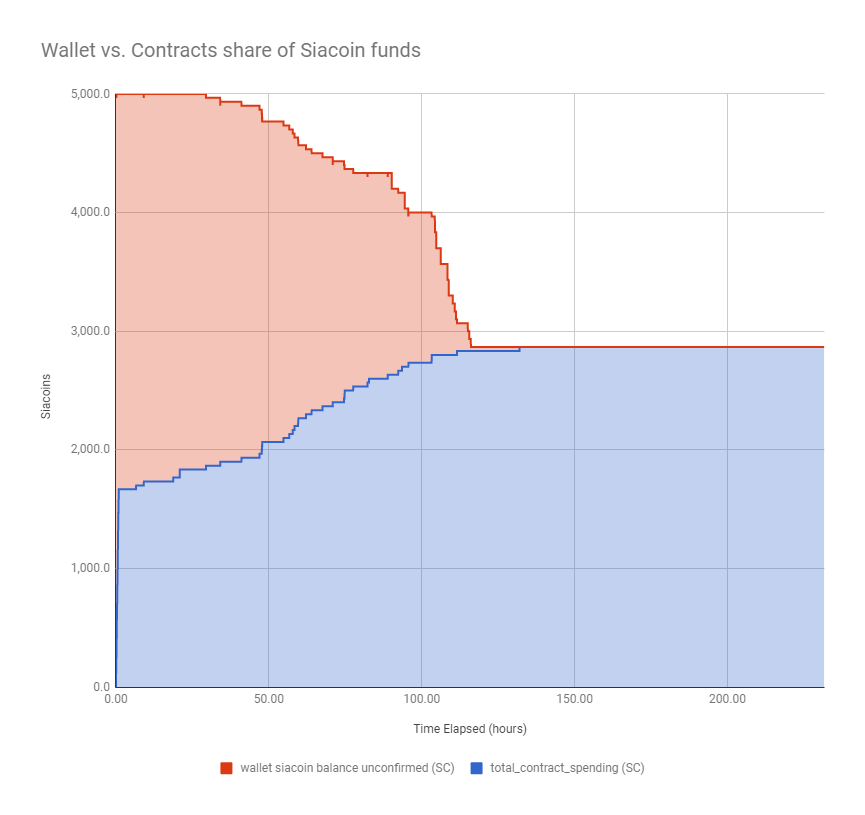
In response to the previous load test report, Sia’s lead developer, David Vorick, speculated that Sia could be spending correctly but accounting incorrectly. In other words, it’s possible that Sia actually used the missing 2,133.3 SC to purchase contracts, but the value of those contracts did not appear in Sia’s self-reported metrics.
There are three possibilities (from worst to best):
- Sia is burning funds by spending money and getting nothing in return.
- Sia is buying and using contracts, but failing to properly account for the spending.
- Sia is not spending this money at all; the full amount will return to the user’s wallet at some point.
It’s not possible to know which possibility is correct until the team investigates, but Vorick stated that the Sia dev team has “pushed it back in priority” as they focus on other features.
Sia’s cost estimates were inaccurate by a factor of 3
Sia offers an API that allows clients to retrieve price estimates before they purchase storage on Sia. The load test script snapshots the response from this API just before it purchases contracts.
In this test, the estimated prices at the start of testing were as follows:
| Cost | Price Estimate via Sia API |
|---|---|
| Storage (per TB/mo) | 96.5 SC |
| Upload bandwidth (per TB) | 27.7 SC |
| Contract fees | 56.2 SC |
I uploaded 4.77948797 TB in the test. Based on Sia’s reported prices, the total estimated cost for storing this data was:
= (96.5 SC/TB/mo * 4.77948797 TB * 2.77 mo) + << storage
  (27.7 SC/TB * 4.77948797 TB) +              << upload bandwidth
  (56.2 SC)                                   << contract fees

= 1278.1 SC +                                 << storage
  132.2 SC +                                  << upload bandwidth
  56.2 SC                                     << contract fees

= 1466.5 SC                                   << total cost
In reality, the total cost was 4,377.1 SC, roughly 3x the estimated price.
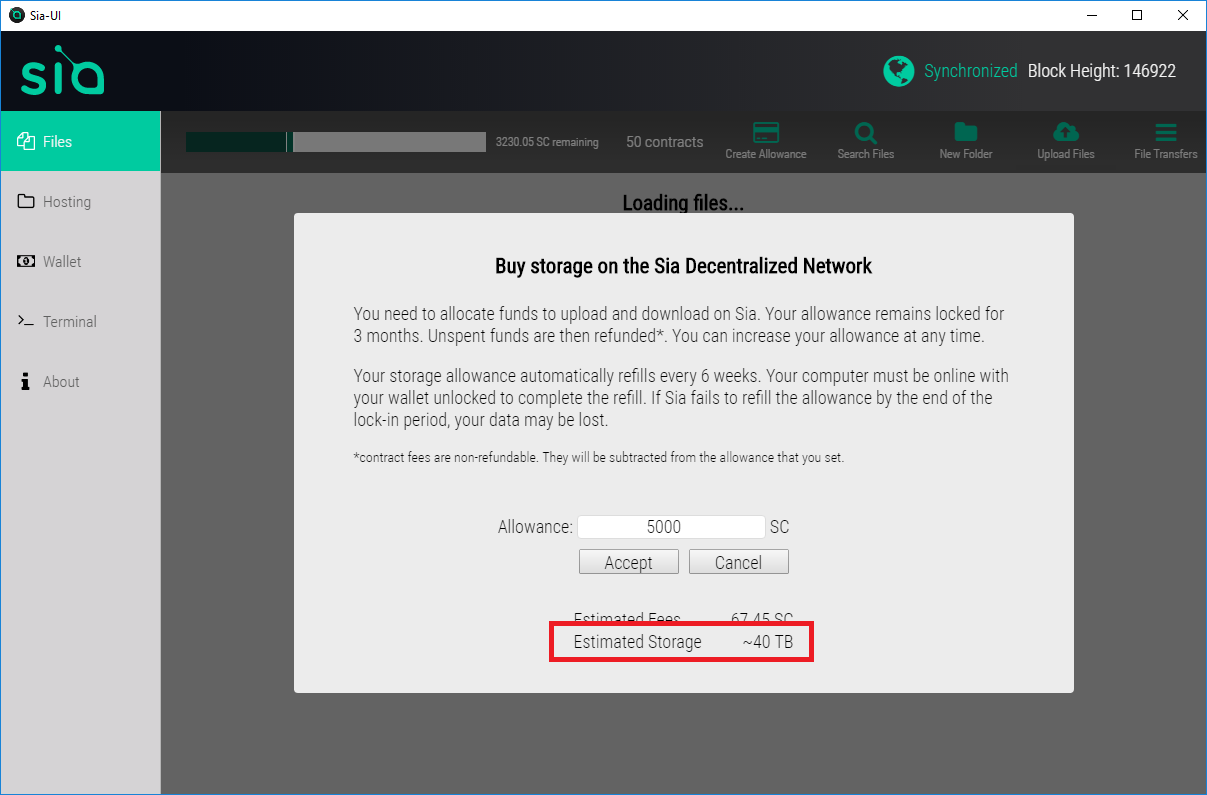
Sia-UI’s storage estimates were inaccurate by a factor of 8
When you set a renter allowance with Sia-UI, it gives you an estimate of how much you can buy with the funds. Sia-UI estimated that 5000 SC would buy 40 TB of space. This estimate is over 8x higher than what 5000 SC purchased in practice.
I dove into Sia-UI’s code for calculating storage estimates:
const estimate = new BigNumber(SiaAPI.siacoinsToHastings(action.funds))
    .dividedBy(response.storageterabytemonth).times(1e12)

yield put(actions.setStorageEstimate(
    '~' + readableFilesize(estimate.toPrecision(1))))
This calculation suffers from two flaws:
- It assumes that contract fees and upload costs are zero.
- It treats the Sia API’s estimate of cost per month as a cost per contract term, which is 12 weeks (2.77 months).
I filed bug #775 to track this.
Sia optimizes for performance over cost
I’ve pointed out in previous experiments Sia’s contract management behavior is unexpected. Sia regularly purchases new contracts even when it has over 1000 SC of unused funds already in contracts.
The Sia dev team clarified that this is intended behavior:
If one contract drains, it’ll be renewed even if the other contracts have money in them. To see that purple line jumping around like that is not unexpected, especially considering that it’ll iirc triple the strength of contracts that ran out of money.
-David Vorick, Sia Lead Developer
Still, there seems to be some room for improvement here. If Sia’s behavior is to buy contracts from a wide array of hosts and then double down on the high-performing ones, it should start with small contracts, then purchase progressively larger contracts as it discovers which hosts perform well.
Instead, Sia currently spends exactly 0.667% of renter allowance on every contract. The smaller the contract, the higher the percentage of spending is lost to fees. In this test, fees accounted for 22% of Sia’s contract spending. Sia could likely lower this frictional cost by purchasing in bulk from high performing hosts.
Upload bandwidth
The test uploaded 4.3 TiB of file data in 231.7 hours. That’s equivalent to an overall average upload bandwidth of 45.8 Mbps.
Note: Bandwidth measurements in this test are non-rigorous due to the limitations of my test infrastructure. I ran these tests on my home FiOS connection. My ISP offers no bandwidth guarantees, and I also used my connection for other bandwidth-intensive activities while the test was in progress. Sia would likely show higher bandwidth on an uncontested, server-grade network link.
Bandwidth was strong for the first 2.5 TiB
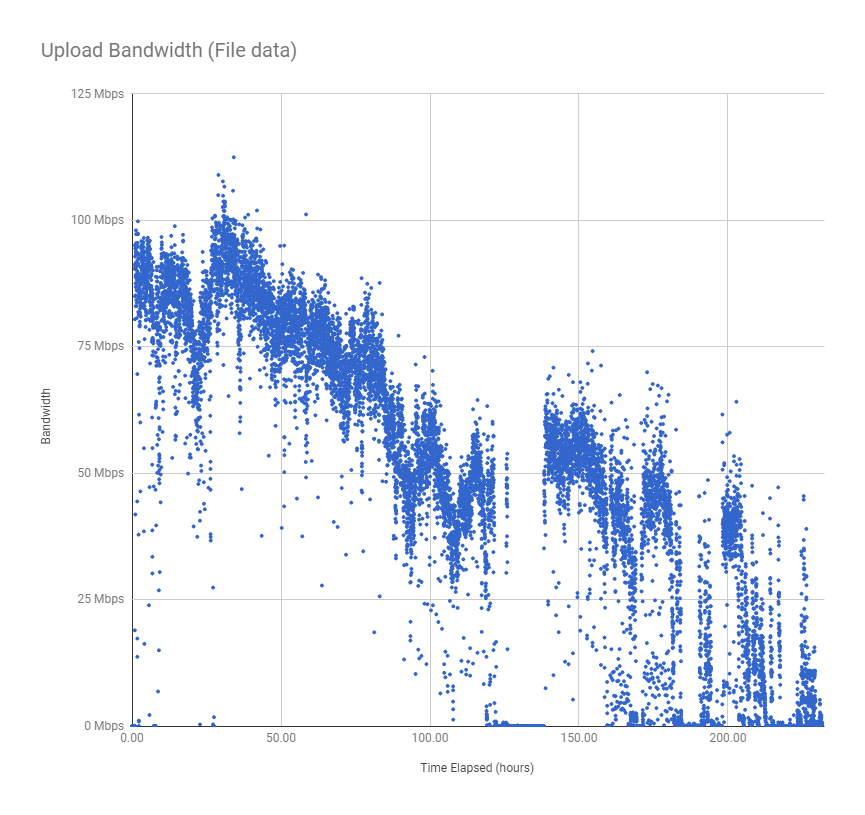
For the first 75 hours of the test (until about 2.5 TiB of file data uploaded), Sia’s bandwidth hovered between 75 to 100 Mbps, which is very impressive. It’s slower than traditional providers like Amazon S3 or Google Cloud Storage, but it’s fast enough to support real backup scenarios. At a rate of 100 Mbps, you could upload 1 TiB of file data per day.
Bandwidth degraded continuously after 2.5 TiB
After 2.5 TiB, the graph shows a continued decline in bandwidth. This may be a function of total data size or file count, but there isn’t enough information to say yet.
The graph shows several stretches of zero bandwidth as Sia stopped uploading new data to increase redundancy of old data.
Test terminated due to bandwidth
The test automatically terminated after 231.7 hours when absolute bandwidth dropped below 3 Mbps. This is one of the exit conditions defined in the test plan.
API latency
All the metrics shown in this report come from three Sia daemon APIs that sia_metrics_collector polls:
/renter/contracts/renter/files/wallet
The API latency is the total amount of time required to call these three APIs in sequence:
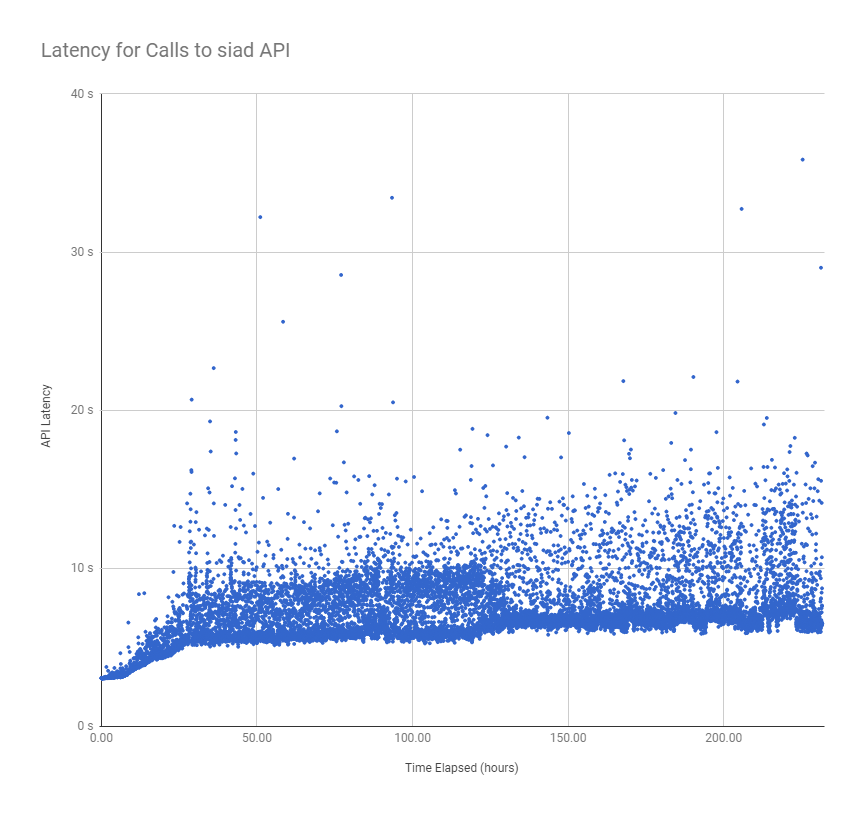
The latency graph is an interesting change from the previous test case. In that experiment, the API latency contained brief spikes in latency and many random outliers. This graph is much more regular and clustered. There are no sustained spikes, and there’s almost a precise “floor” for each point on the graph where all the measurements cluster.
API latency is high
The previous test case saw latencies of up to 5 minutes, so relative to that, a latency in the 5-20s seems pretty low. Still, it’s high considering that this is communication between two processes on the same physical machine. High latencies present obstacles for developers building applications on top of Sia.
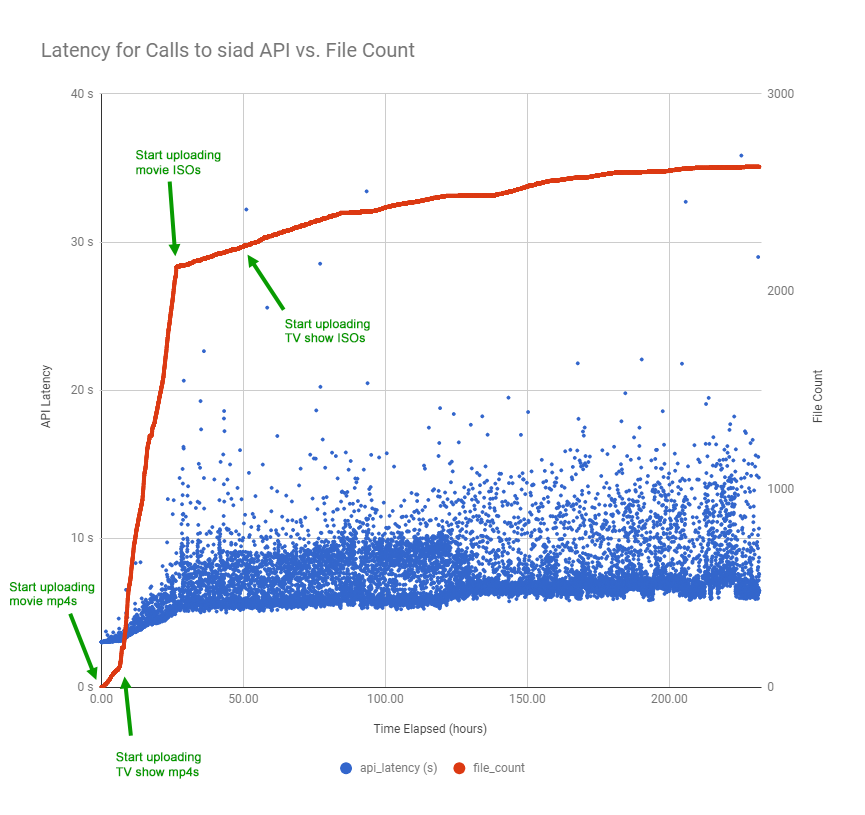
API latency appears to be a function of file count
The latency increases matched increases in file count. Recall that I was uploading files in order of their type:
- Movies, encoded to mp4
- TV show episodes, encoded to mp4
- Movies (as raw disc ISOs)
- TV Shows (as raw disc ISOs)
The different file types vary widely in size, so the file count’s rate of change varied through the test. Plotting the file count against the latency, it appears that the rate of increase in latency was tightly correlated with the rate of increase for file count:
Raw data
Test notes
- Sia v1.3.2 was released while this test was running. While all cases in this load test will use 1.3.1 for consistency, the 1.3.2 release may affect results as hosts upgrade to the latest Sia version.
- The load test script crashed at 2018-03-12 03:17:48Z (at the 7.23 hours elapsed mark). It was down for approximately 40 minutes. During this time, upload bandwidth drops to zero, but this is due to testing error rather than Sia underperformance. All other bandwidth measurements in the test are accurate measures of Sia’s performance.
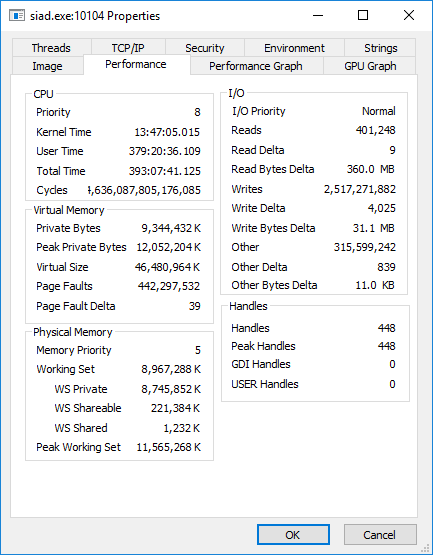
- I did not track CPU/RAM usage rigorously during this test, but I did note that at one point, Sia’s RAM usage reached 11.5 GB. Process Explorer reported that its total virtual memory usage was over 46 GB.
Reproducing results
All steps to reproduce these results are available in the sia_load_tester README.
You won’t be able to reproduce it exactly without the same DVD collection, but any DVD collection or similarly sized files should work.
Corrections
- A previous version of this report incorrectly that the estimates from Sia’s
/renter/priceswere too high. In fact, they were too low. I originally converted the/renter/pricesoutput from hastings to Siacoins using a conversion factor of 10-23, but the correct conversion is 10-24.