Sia Load Test Result 3: Best-Case Scenario
In February, I announced the first ever load test of Sia. The load test consists of three distinct test cases:
- Worst-case scenario (published 2018-03-15)
- Real data scenario (published 2018-03-23)
- Best-case scenario (this report)
This test was intended to use synthetic input files to maximize Sia’s storage capacity. Interestingly, this test underperformed the real data test, which used actual data instead of synthetic files.
Results summary
| Metric | Value |
|---|---|
| Total uploaded | 1.5 TiB (file bytes) 7.2 TiB (absolute bytes) |
| Storage efficiency | 21.5% |
| Total files uploaded | 40,552 |
| Total file contracts created | 68 |
| Total spent | 1,840 SC $25.21* USD |
| $ per TB/month | $5.13** |
| Total test time | 336.0 hours (14.0 days)*** |
| Average upload bandwidth | 11.2 Mbps (file data) 52.2 Mbps (absolute) |
| Sia crashes | 0 |
| Sia version | 1.3.1 |
| Test OS | Win10 x64 |
* Based on Siacoin value at test start (1.370 cents per SC). Assumes that unused renter funds will successfully return to the test wallet at the conclusion of the renter contracts.
**Assumes that a standard renter contract lasts 2.77 months. Excludes bandwidth costs.
*** Test was manually terminated at 14 days, as that was the maximum test duration.
File bytes vs. absolute bytes
(feel free to skip this if you read this in the previous report)
On traditional cloud storage providers like Amazon S3 or Google Cloud Storage, there is a 1:1 ratio between the size of your files and the amount of data for which you are billed. If you upload 100 GiB of files, you pay for 100 GiB of upload bandwidth and for 100 GiB of storage space.
Sia’s costs are more complicated. If you upload 100 GiB of files, the best you can hope for is to pay for 300 GiB in bandwidth and storage (due to Sia’s 3x replication). In practice, the cost is not easily predictable, as it depends on how efficiently Sia repackages your files and how reliable your hosts are.
To keep the semantics clear, I introduce two terms for distinguishing between these metrics:
File bytes is the total number of bytes in files uploaded to Sia.
Absolute bytes is the total amount of data uploaded to hosts, including Sia metadata, file padding, and redundant copies of the data.
If you upload a 100 GiB file and it causes to Sia upload 350 GiB to hosts, that represents a 100 GiB increase in file bytes and a 350 GiB increase in absolute bytes.
File data bandwidth vs. absolute bandwidth
(feel free to skip this if you read this in the previous report)
Because of the distinction between file bytes and absolute bytes, a similar disambiguation is required for bandwidth. In this report, I distinguish between file data bandwidth and absolute bandwidth.
The simplest way to explain them is through an example:
- User uploads a 500 MB file to Sia.
- Sia breaks this file into 12 equally-sized chunks of ~42 MB each, totaling ~504 MB.
- Sia uploads each chunk to three different hosts.
- All uploads complete after 40 seconds.
The file data bandwidth is simply the size of the file divided by the upload duration:
= 500 MB / 40 seconds
= 4000 Mb / 40 seconds
= 100 Mbps
The absolute bandwidth is the total amount of data transferred divided by the upload duration:
= ((42 MB * 12 chunks) * 3 hosts) / 40 seconds
= ((504 MB) * 3 hosts) / 40 seconds
= 1512 MB / 40 seconds
= 12096 Mb / 40 seconds
= 302.4 Mbps
File data bandwidth is what matters
If you have 50 TiB of data to upload to Sia, and you want to know how long this will take, that’s the file data bandwidth.
The absolute data bandwidth is useful to guide Sia developers in designing their upload algorithms, but it is not directly relevant to users.
In this report, I focus on file data bandwidth.
Input data
The input files in this test were designed to maximize Sia’s storage efficiency.
Because Sia breaks files up into chunks of exactly 41942760 bytes (~40 MiB) each, it adds padding to the end of a file so that the file’s size divides evenly by 41942760.
In the worst-case scenario test, I used files of 1 byte each. This caused Sia to generate chunks that were almost entirely padding, resulting in abysmal efficiency.
With files of exactly 41942760 bytes, Sia does not need to add any padding. In theory, files of this size should allow Sia to maximize its storage capacity and minimize cost.
Test machine crash
At 2018-04-01 at 12:47:56Z (249.5 hours into testing), my Windows test machine crashed. I rebooted it and resumed the load test a few minutes later, but you’ll see in the graphs below that this crash had a significant impact on results.
I was unable to analyze the Windows crash dump, and I don’t have any evidence that Sia caused it. My desktop does crash roughly once per month, so this was not out of the ordinary.
The crash complicates my analysis, but it also reveals interesting behavior in Sia.
Storage efficiency
To measure how well Sia stores data, I created the metric of “storage efficiency,” which is simply the file bytes divided by the absolute bytes.
On traditional cloud storage providers, efficiency is 100% because you pay for exactly the size of your files. On Sia, the best possible efficiency is 33.3% because Sia uploads every byte of file data at least three times for redundancy. Other factors can degrade efficiency, such as inefficient repackaging of files or unreliable hosts.
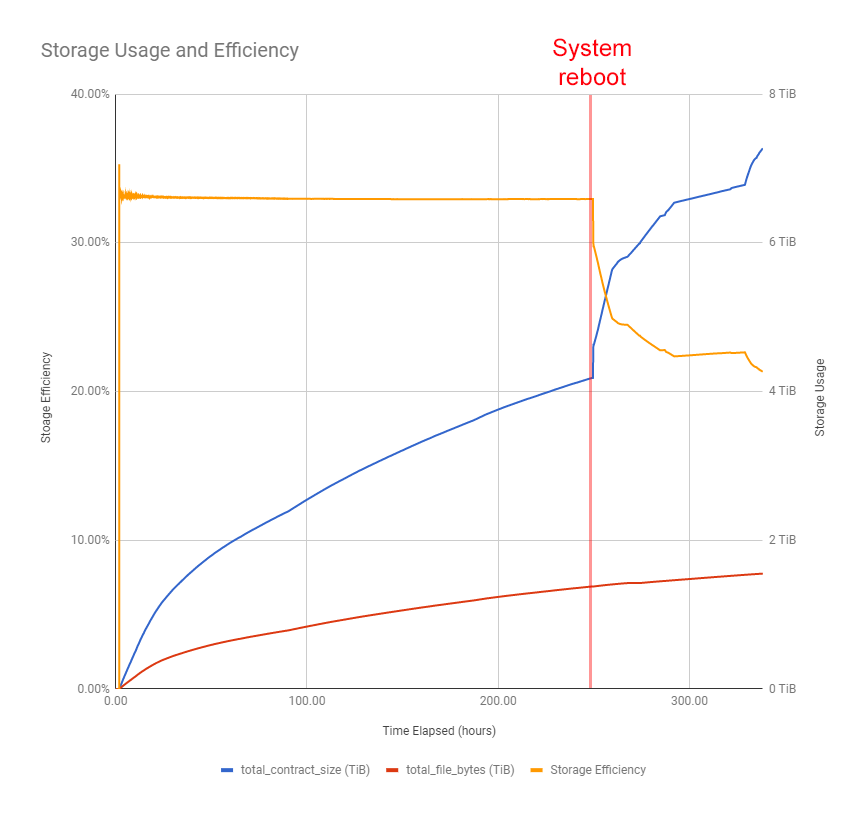
Efficiency was stable at 33% for most of the test
As mentioned above, Sia’s best possible storage efficiency is 33.3%. For most of the test, Sia achieved an efficiency very close to this, at 33.0%. This indicates that the test was successful at crafting input files that maximized Sia’s storage efficiency.
Efficiency plummeted after Sia’s restart
The efficiency graph shows a significant drop immediately after the reboot. This was unexpected because rebooting a Sia server shouldn’t affect efficiency.
I examined the renter.log file and saw that prior to the reboot, Sia found very few file chunks in need of repair:
2018/04/01 08:17:19.265574 repairscanner.go:330: Repairing 1 chunks
2018/04/01 08:34:07.031143 repairscanner.go:330: Repairing 2 chunks
2018/04/01 08:49:19.697486 repairscanner.go:330: Repairing 0 chunks
2018/04/01 09:04:31.972274 repairscanner.go:330: Repairing 0 chunks
When I restarted Sia after the crash, it determined that a very high number of chunks needed repairs:
2018/04/01 12:55:47.281709 persist.go:403: STARTUP: Logging has started. Siad Version 1.3.1
2018/04/01 13:01:19.057547 repairscanner.go:330: Repairing 7 chunks
2018/04/01 13:18:16.239757 repairscanner.go:330: Repairing 36107 chunks
2018/04/01 22:52:47.761800 repairscanner.go:330: Repairing 16325 chunks
2018/04/02 01:22:29.756573 repairscanner.go:330: Repairing 27345 chunks
2018/04/02 08:56:46.854863 repairscanner.go:330: Repairing 31010 chunks
This strongly suggests a bug in Sia, as a reboot should not suddenly require this many file repairs.
It’s possible that the reboot invalidated file contracts by preventing Sia from writing the latest contract versions to disk, but Sia’s write-ahead log is supposed to prevent this type of data corruption.
Alternatively, this could be the result of flaky hosts, but it’s unlikely that hosts became flaky immediately after my test machine rebooted.
Final efficiency was worse than the real data test
The previous test case finished with a storage efficiency of 28.3%, while this test finished significantly below that, at 21.5%.
This is unexpected, given that this test optimized specifically for storage efficiency. The first 250 hours reflected this, but Sia’s aggressive data reuploading post-reboot dragged down storage efficiency.
Cost
Cost per TB was $5.13
This test was designed to achieve the lowest possible storage costs, but it underperformed the previous test that used real data. The high cost was a combination of poor efficiency (discussed above) and low upload bandwidth.
Sia’s average upload bandwidth throughout the test was only 11.2 Mbps. Sia should have been able to upload about 4 TiB of data in its 68 contracts, but filling those at 11.2 Mbps would take ~35 days. In other words, by the time you uploaded 4 TiB, half the storage contract would be over.
Given that this load test was limited to 14 days, the upload bandwidth was too low for Sia to fill its storage contracts to capacity within this window.
Sia’s contract count is inaccurate
Before the system crashed, Sia reported a contract count of 52 at time 2018-04-01T12:47:49Z. Then, after the system rebooted, Sia reported a contract count of 58 at 2018-04-01T13:04:03Z.
Sia’s contractor.log shows no new contracts being formed in this window:
2018/04/01 12:41:53.929749 contracts.go:479: WARN: failed to renew contract 6733d90c9412f269a7a583ae0c297dc173a8d02b1deca3118a3eaac9c618f857: host did not accept our proposed contract: internal error: host has reached its collateral budget and cannot accept the file contract
2018/04/01 12:55:42.820989 contractor.go:194: STARTUP: Logging has started. Siad Version 1.3.1
2018/04/01 13:05:44.958722 contracts.go:426: renewing 1 contracts
2018/04/01 13:05:45.492354 contracts.go:479: WARN: failed to renew contract 6733d90c9412f269a7a583ae0c297dc173a8d02b1deca3118a3eaac9c618f857: host did not accept our proposed contract: internal error: host has reached its collateral budget and cannot accept the file contract
A grep of the contractor log shows 62 lines where a contract was formed and 17 where a contract was renewed, but these numbers don’t match the final count of 68 contracts from Sia’s /renter/contracts API.
$ grep "Formed contract" contractor.log  | wc -l
62
$ grep "Renewed contract" contractor.log  | wc -l
17
I compared a snapshot of the /renter/contracts API just after the reboot to one captured 12 hours prior and found the six new contract IDs that suddenly appeared after the reboot:
f76fb41f7f171809d4c30f8d12be03ea8cdce4b6a06a622880a6205806a6de07
988c0a6b333b6e4bdaa9d0274468512d44bf972acb4b9d78c87860b6fe03da19
7af5728975519eca7b2fc2245adc8dcdd1e245847c72b0d7b377192149089881
ede949e90ab8932b75468a58d54cc465111a275515d3b7adbc96059cc4c40e4a
e751ff0f049e97680715cef9452dc0416ab280d8bbee31d84d553eecbae7a94d
47f1260cec7171878c0c7ad1f996c9c1beae5d0b73999ea58541b3d5d450a454
It was difficult to debug further because Sia does not log a contract’s ID when it is formed. I submitted PR #2933 so that Sia logs this information in the future.
Sia’s incorrect contract accounting seems related to bugs causing fund disappearance
I’ve replicated bug #2772 in every test I’ve run. It occurred in this test but with a twist.
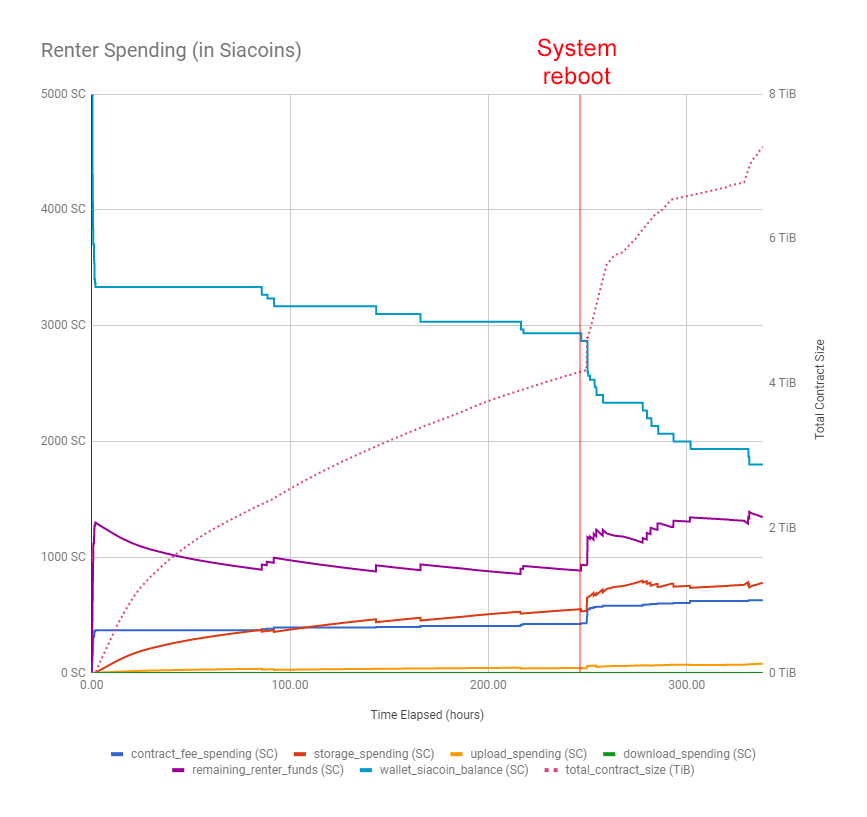
As Sia spends money from the 5,000 SC allocated for this test, the money should move from the Sia wallet into Sia contracts, maintaining a constant sum of 5,000 SC. The graph below shows that the funds start by totaling 5,000 SC but then gradually decrease as funds disappear.
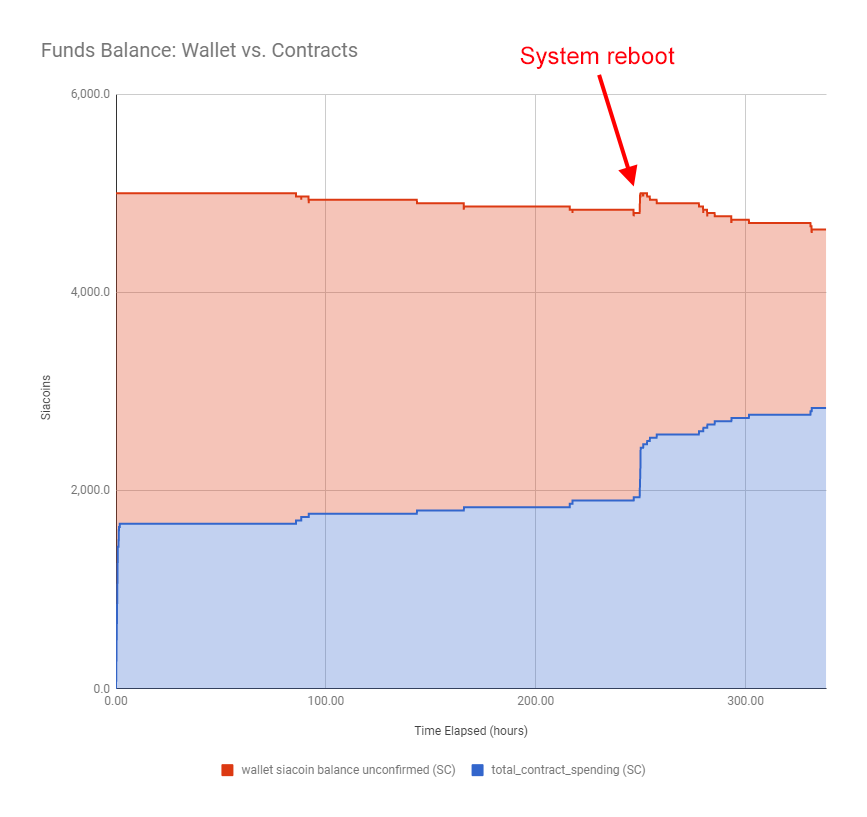
The twist in this case was that just after the system reboot, total funds increased. At the 249.0 hour mark, contract spending and wallet balance summed to 4,800 SC, leaving 200 SC missing.
After the reboot, but before Sia began purchasing new contracts, Sia’s contract count jumped from 52 to 58 and its contract spending jumped from 1,933 SC to 2,133 SC, eliminating the 200 SC discrepancy. During this time, Sia’s wallet balance remained at 2,867 SC with no incoming or outgoing transactions. 2,133 SC and 2,867 SC sum to 5,000 SC, which is the expected total because that was the wallet balance at the start of the test.
This result supports the Sia dev team’s conjecture that bug #2772 is a symptom of bad accounting rather than lost funds.
Upload bandwidth
The test uploaded 1.5 TiB of file data in 336.0 hours. That’s equivalent to an overall average upload bandwidth of 11.2 Mbps. This is very low, but note that this test was designed to optimize for storage efficiency, not upload bandwidth.
Note: Bandwidth measurements in this test are non-rigorous due to the limitations of my test infrastructure. I ran these tests on my home FiOS connection. My ISP offers no bandwidth guarantees, and I also used my connection for other bandwidth-intensive activities while the test was in progress. Sia would likely show higher bandwidth on an uncontested, server-grade network link.
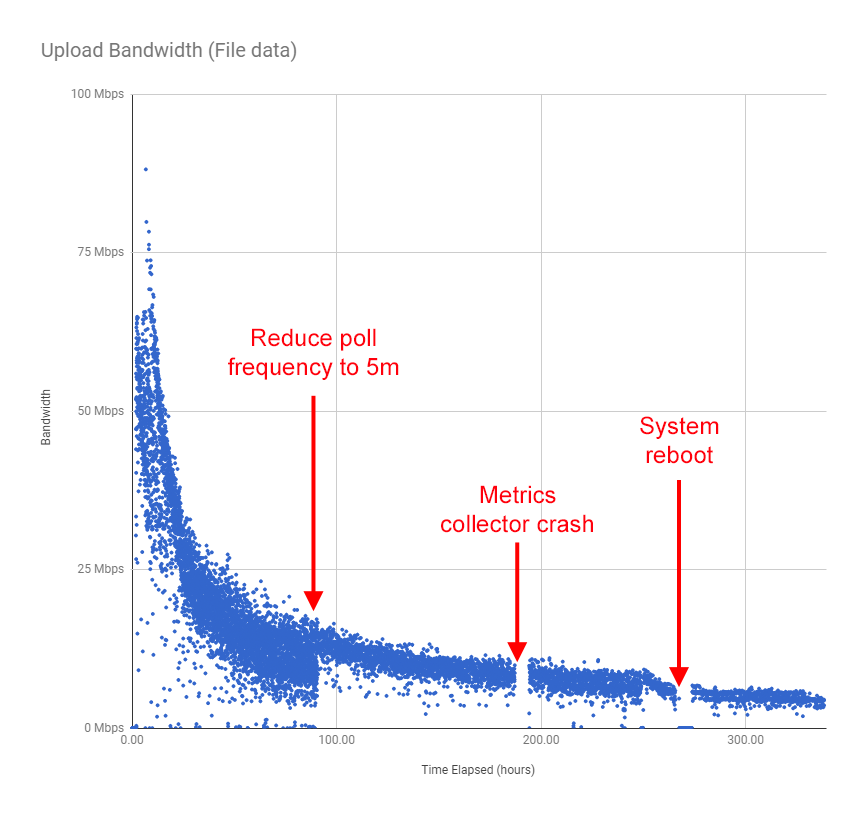
Upload bandwidth slowed exponentially with file count
The graph of upload data shows that upload speeds slowed exponentially as the test progressed.
In response to the first test case, the Sia dev team noted that Sia does not perform well when it exceeds 2,000 files. This test increased beyond 2,000 files in its first 6 hours, which likely explains the slow speeds.
File size has a substantial impact on upload bandwidth
This test never broke 90 Mbps, whereas the previous test (using real files) maintained an upload bandwidth of > 90 Mbps for several hours. I believe this is due to the difference in file sizes between the two tests.
I was surprised by this result. I assumed that because Sia is breaking files into 40 MiB chunks, performance should be similar between a single 400 MiB file and ten 40 MiB files. This test indicates that Sia’s upload bandwidth is higher for very large files. The previous test didn’t optimize for efficient storage, but its files were on average 43x larger.
API latency
All the metrics shown in this report come from three Sia daemon APIs that sia_metrics_collector polls:
/renter/contracts/renter/files/wallet
The API latency is the total amount of time required to call these three APIs in sequence:
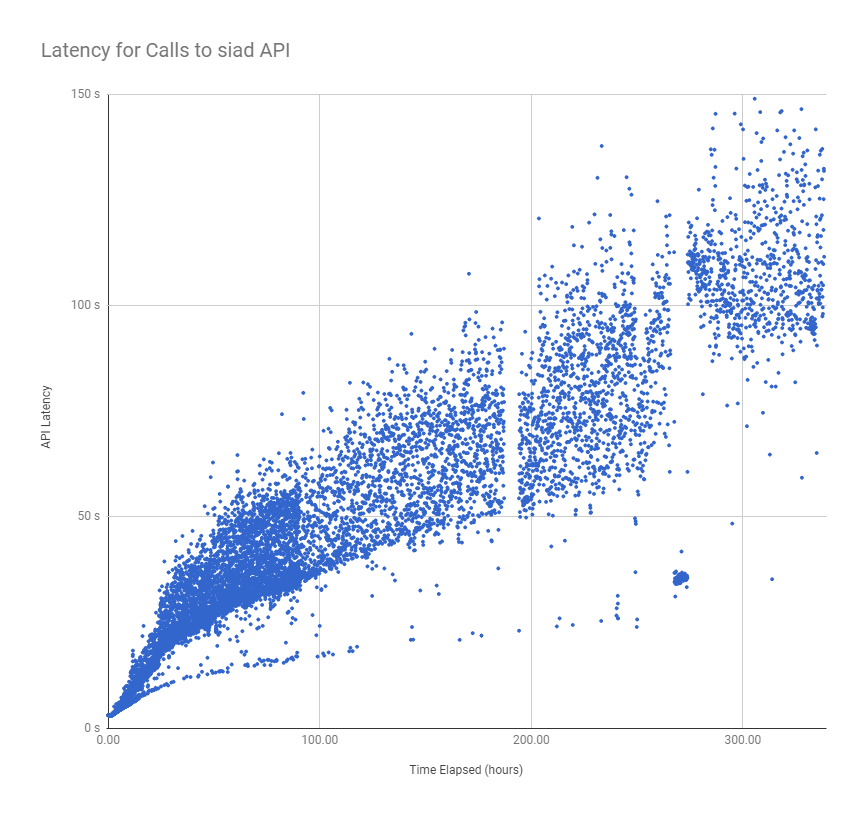
API latency is high
Results are similar to the worst-case scenario test in that latency increased throughout the test. Even at the beginning of the test, Sia generally took ~3 seconds to reply to all three API calls, which is very high given that it’s communication between processes on the same system.
API latency grows linearly with file count
Results from all of the tests indicate that API latency increases linearly with the number of files the Sia node uploads.
Raw data
Test notes
- I manually terminated the test after 14 days, as that is the maximum length of each load test.
- Sia v1.3.2 was released before this began. While all cases in this load test used 1.3.1 for consistency, the 1.3.2 release may affect results as hosts upgrade to the latest Sia version.
- The metrics collector crashed at 2018-03-29 22:26Z (at the 187 hours elapsed mark). It was down for approximately 7 hours before I restarted it manually.
Reproducing results
All steps to reproduce these results are available in the sia_load_tester README.
Wrap up
Stay tuned for a follow-up post in the next week or two. Each of these write-ups has been fairly low-level, so I’m going to do a high-level wrap up of my takeaways from testing and what the results mean for Sia’s future.
Corrections
- A previous version of this report incorrectly stated the TB/mo price at $10.36/TB/mo. The correctly calculated value is $5.13/TB/mo. Thanks to David Vorick for the correction.