Sia Load Test Result 1: Worst-Case Scenario
Last month, I announced the first ever load test of Sia. The load test consists of three distinct test cases:
- Worst-case scenario (this report)
- Real data scenario (published 2018-03-23)
- Best-case scenario (published 2018-04-12)
Today, I’d like to share the result of the first test case, the worst-case scenario. For this test case, I uploaded thousands of 1-byte files to Sia. Because Sia is optimized for large files, a dataset composed exclusively of tiny files should yield its worst performance.
Cutting the test short
I cut this test case short at around the 25-day mark. The test had not met any of the test plan’s exit conditions, but at the rate it was going, it could have taken months to complete.
For the remaining two test cases, I’m adding an additional exit criteria to keep tests from running indefinitely: the maximum runtime will be 14 days per test case.
Results summary
| Metric | Value |
|---|---|
| Total uploaded | 47.2 KiB (file bytes) 9.8 TiB (absolute bytes) |
| Storage efficiency | 0.0000004470% |
| Total files uploaded | 48,358 |
| Total file contracts created | 60 |
| Total spent | 3625 SC $50.75* USD |
| $ per TB/month | $350 million [sic]** |
| Total test time | 596.8 hours (24.9 days) |
| Average upload bandwidth | 0.00000018 Mbps (file data) 40.3 Mbps (absolute) |
| Sia crashes | 0 |
| Sia version | 1.3.1 |
| Test OS | Win10 x64 |
* Using the 2018-03-11 price of 1.4 cents per SC. Assumes that unused renter funds will successfully return to the test wallet at the conclusion of the renter contracts.
** Cost per TB is ludicrously high because this particular test case optimizes for high file count at the expense of efficient storage.
File bytes vs. absolute bytes
On traditional cloud storage providers like Amazon S3 or Google Cloud Storage, there is a 1:1 ratio between the size of your files and the amount of data for which you are billed. If you upload 100 GiB of files, you pay for 100 GiB of upload bandwidth and for 100 GiB of storage space.
Sia’s costs are more complicated. If you upload 100 GiB of files, the best you can hope for is to pay for 300 GiB in bandwidth and storage (due to Sia’s 3x replication). In practice, the cost is not easily predictable, as it depends on how efficiently Sia repackages your files and how reliable your hosts are.
To keep the semantics clear, I introduce two terms for distinguishing between these metrics:
File bytes is the total number of bytes in files uploaded to Sia.
Absolute bytes is the total amount of data uploaded to hosts, including Sia metadata, file padding, and redundant copies of the data.
If you upload a 100 GiB file and it causes to Sia upload 350 GiB to hosts, that represents a 100 GiB increase in file bytes and a 350 GiB increase in absolute bytes.
File data bandwidth vs. absolute bandwidth
Because of the distinction between file bytes and absolute bytes, a similar disambiguation is required for bandwidth. In this report, I distinguish between file data bandwidth and absolute bandwidth.
The simplest way to explain them is through an example:
- User uploads a 500 MB file to Sia.
- Sia breaks this file into 12 equally-sized chunks of ~42 MB each, totaling ~504 MB.
- Sia uploads each chunk to three different hosts.
- All uploads complete after 40 seconds.
The file data bandwidth is simply the size of the file divided by the upload duration:
= 500 MB / 40 seconds
= 4000 Mb / 40 seconds
= 100 Mbps
The absolute bandwidth is the total amount of data transferred divided by the upload duration:
= ((42 MB * 12 chunks) * 3 hosts) / 40 seconds
= ((504 MB) * 3 hosts) / 40 seconds
= 1512 MB / 40 seconds
= 12096 Mb / 40 seconds
= 302.4 Mbps
File data bandwidth is what matters
If you have 50 TiB of data to upload to Sia, and you want to know how long this will take, that’s the file data bandwidth.
The absolute data bandwidth is useful to guide Sia developers in designing their upload algorithms, but it is not directly relevant to users.
In this report, I focus on file data bandwidth.
Storage efficiency
To measure how well Sia stores data, I created the metric of “storage efficiency,” which is simply the file bytes divided by the absolute bytes.
On traditional cloud storage providers, efficiency is 100% because you pay for exactly the size of your files. On Sia, the best possible efficiency is 33.3% because Sia uploads every byte of file data at least three times for redundancy. Other factors can degrade efficiency, such as inefficient repackaging of files or unreliable hosts.
Sia’s efficiency was terrible on tiny files. No surprise there. Sia rounds small files up to a minimum of ~40 MiB, so the best possible efficiency for a 1-byte file is:
1 byte / (40 MiB * 3 replicas) => 0.0000024%
In this test, efficiency was five times lower than that, at 0.000000447%, meaning that Sia used an average of 213 MiB to upload each 1-byte file.
Sia’s efficiency degraded over time. The graph below shows a consistent pattern of efficiency rising slightly before taking a significant dip. Overall, efficiency decreased substantially as the test progressed.
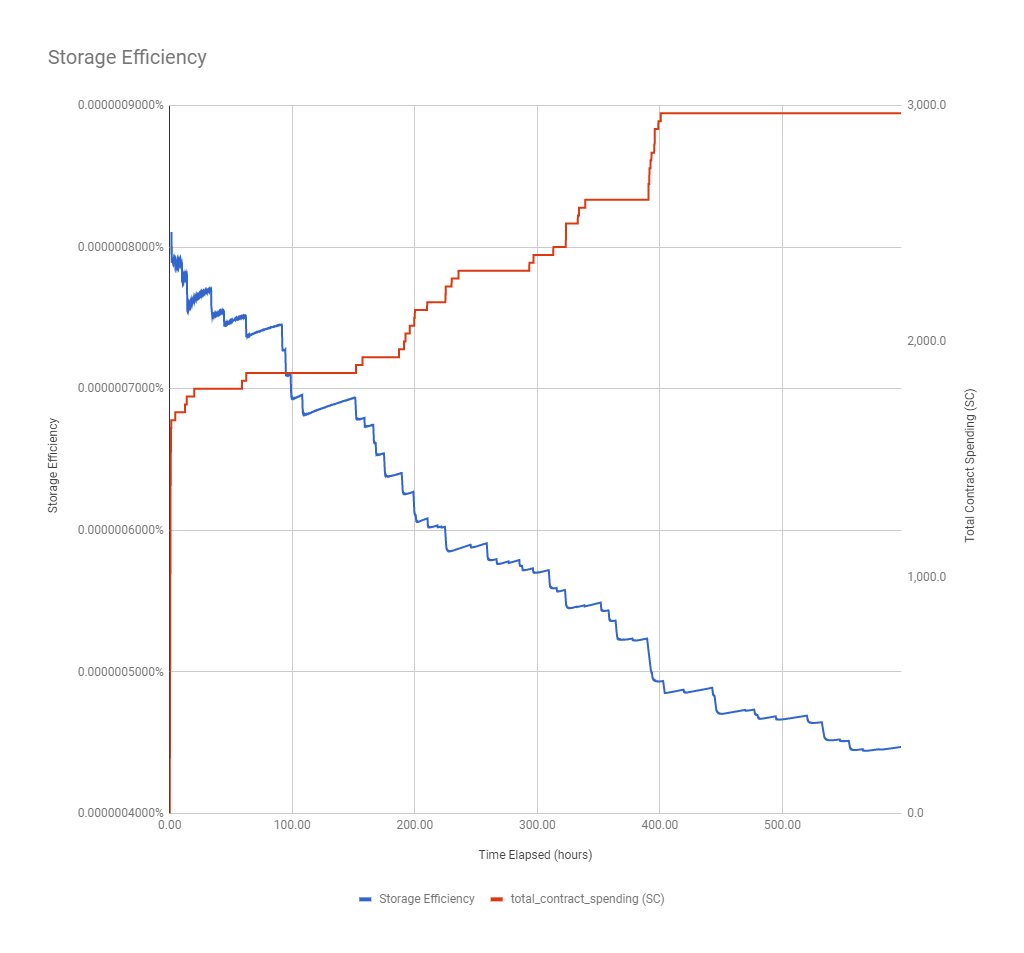
This pattern may be the result of bad hosts. If the test node’s Sia hosts were constantly disappearing, this would drive efficiency down as Sia is forced to reupload data to new hosts. However, this would imply such a high rate of host churn that I’m skeptical this is the whole cause.
Excessive redundancy reduced efficiency. Sia used a much higher replication than it should have. Instead of the 3x replication that I expected, Sia uploaded most files to 5.3x redundancy. One file was uploaded with 11.3x redundancy. This is being tracked as bug #2813.
Cost
Cost per TB/mo was $350 million
This is an amusing result, but not surprising given that the test case deliberately chose input for inefficient storage. At this rate, it would be impossible to purchase 1 TB of storage because the full contract cost exceeds the total number of Siacoins in existence.
58% of costs were due to bugs in Sia
Interestingly, software bugs accounted for the majority of costs in this test case. I estimate that they accounted for at least 58% of the 3625 SC spent in this test.
2033.3 SC disappeared during contract formation
Sia’s biggest expense came from bug #2772, which I discovered in a previous post. It accounted for a whopping 56.1% of the total amount spent in this test.
The graph below reveals this bug. The wallet and renter were in a closed system, so the total number of Siacoins between the two should not have changed until the contracts expired.
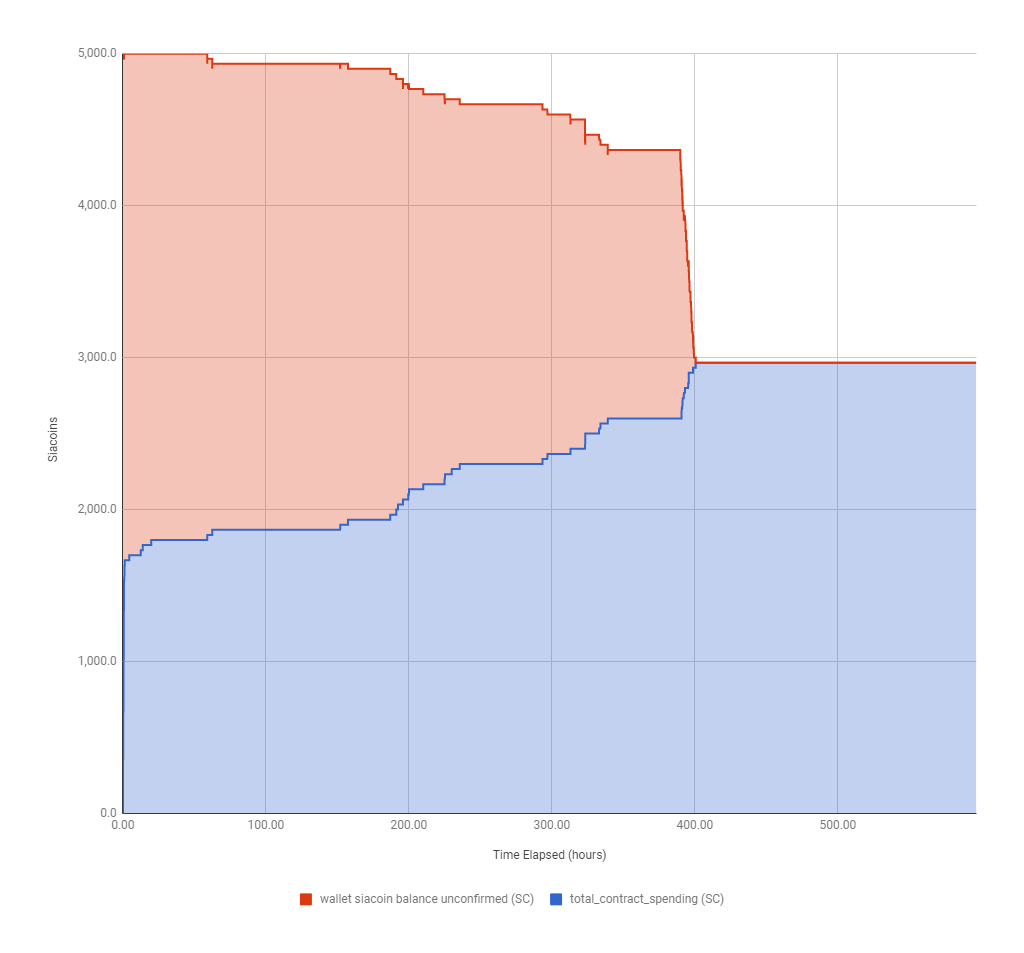
In the first few hours, the wallet and contracts correctly maintain a constant sum of 5000 SC. Over time, money begins to disappear from the wallet without fully reappearing in renter contract spending.
Sia lost 69.3 SC due to premature contract renewal
The graph below shows something interesting around the 400-hour mark. Until that point, Sia had 1,766.7 SC in wallet balance that it had not allocated to contracts. All of a sudden, it spent its entire remaining wallet balance on new contracts, including 69.3 SC in contract fees. This seems to be due to a bug that causes Sia to renew contracts prematurely.
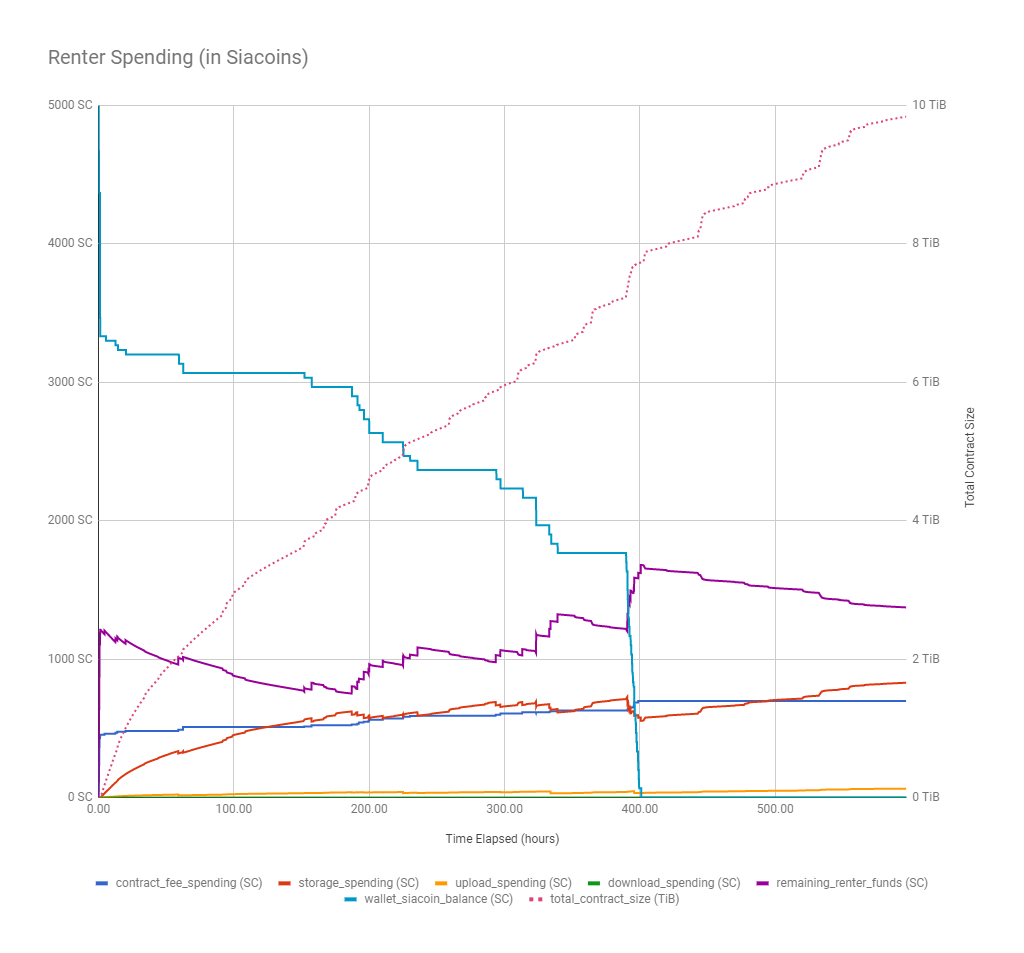
Sia lost money to poor contract management
Sia also lost money due to poor contract management, which I’ve reported previously. The purple line shows the amount remaining in Sia’s storage contracts still available for upload, download, and storage. In theory, Sia shouldn’t form new contracts until this line reaches near zero, but throughout the test, Sia purchased new contracts even with ~1000 SC left in unused renter spending.
Upload bandwidth
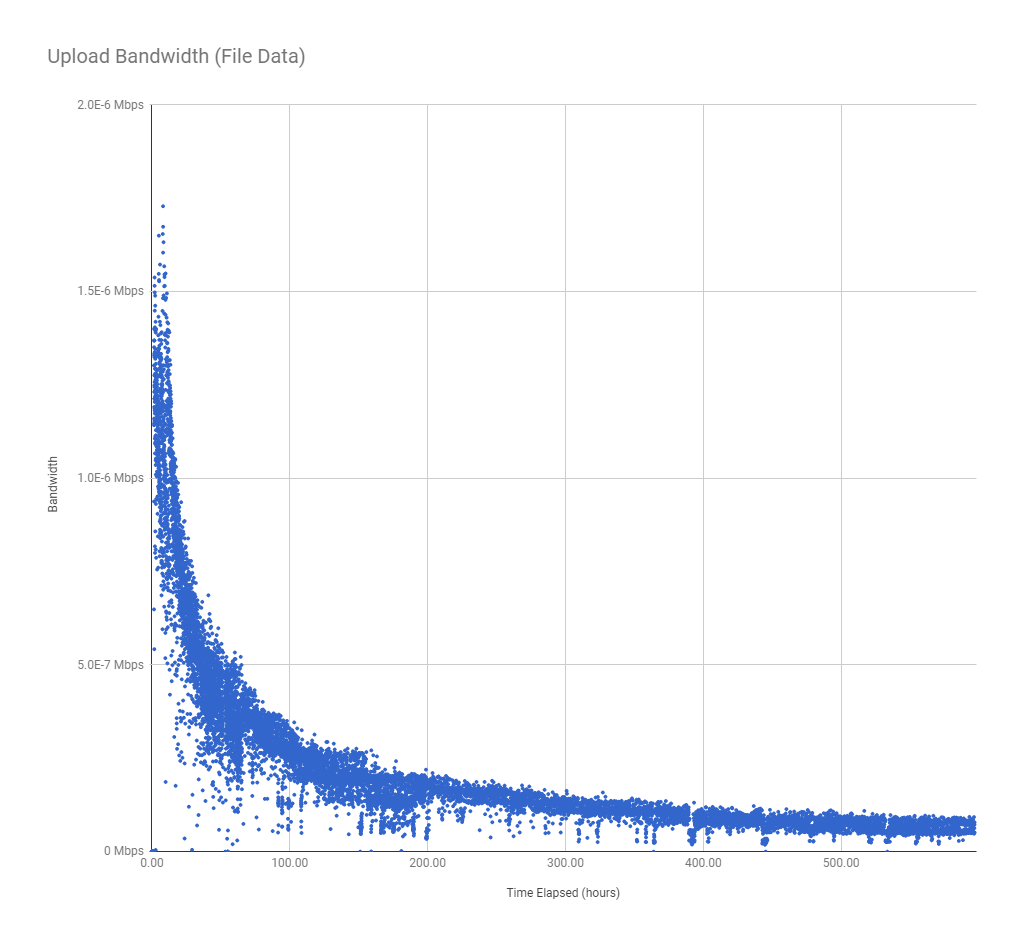
The test uploaded 47.2 KiB of file data in 596.8 hours. That’s equivalent to an upload bandwidth of 1.8 x 10-7 Mbps, which is insanely slow, but that’s expected for this test of worst-case performance.
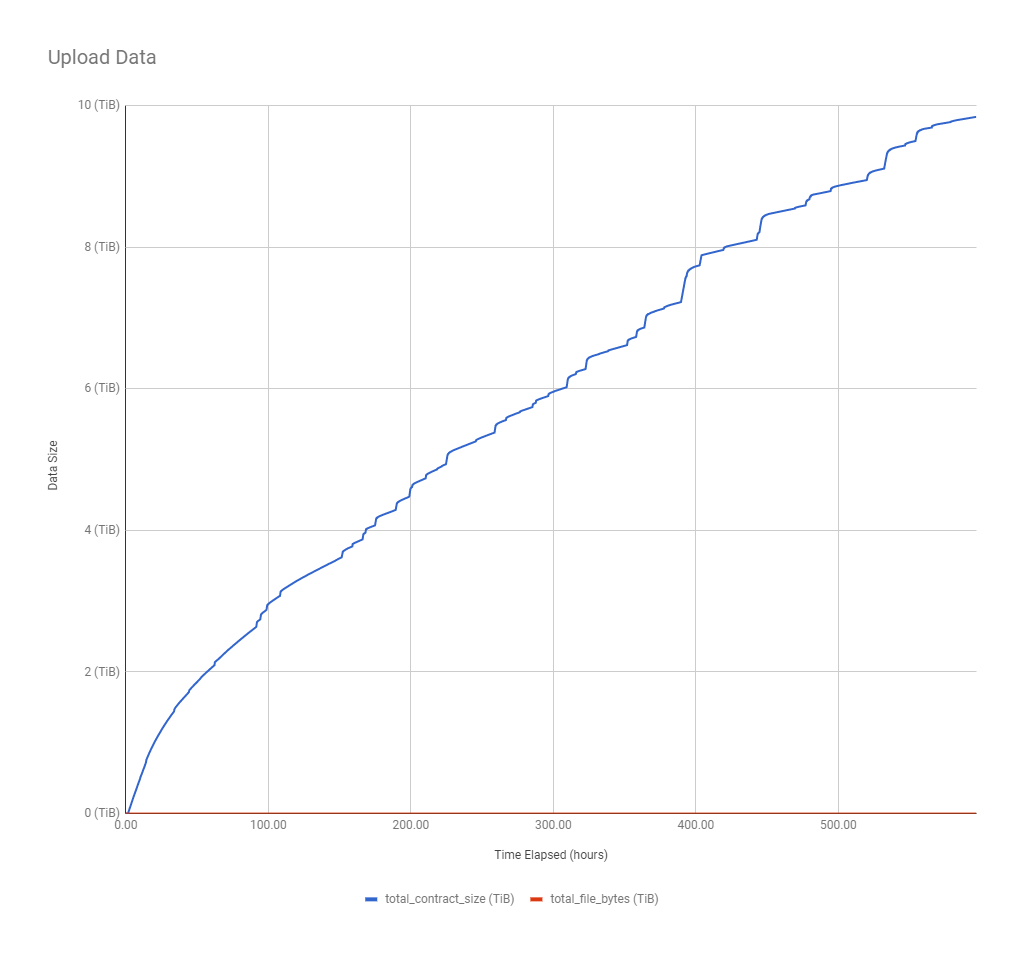
Upload bandwidth slowed exponentially over time
The graph of upload data shows that it got exponentially slower as the test progressed. I don’t have enough data yet to know whether this is a function of time, data uploaded, or file count, but I should have a better picture in subsequent test cases.
Absolute upload bandwidth was bursty
The absolute bandwidth graph shows a curve very similar to file data bandwidth, but with intermittent spikes.
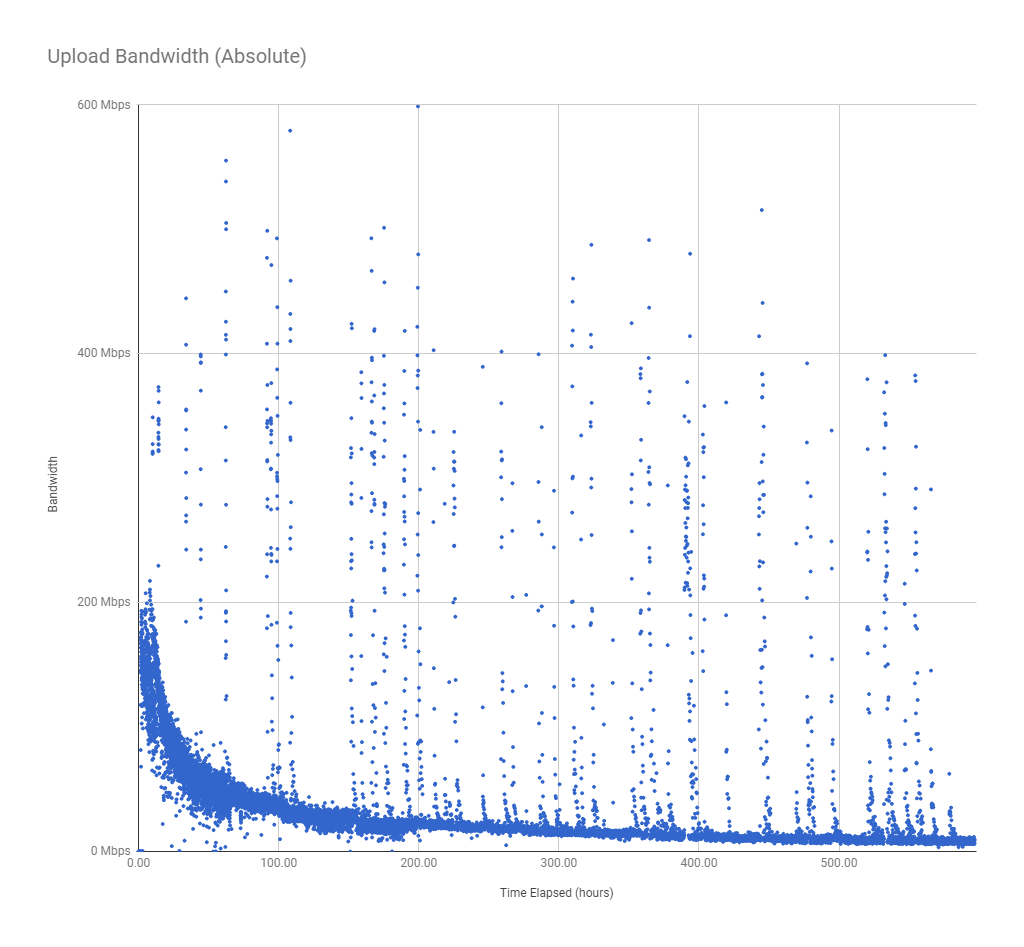
Some measurements reached as high as 600 Mbps, which I think is measurement error due to API latency effects (discussed below). I wondered if these spikes were entirely due to measurement error, but the graph of data uploaded corroborates these spikes:
API latency
All the metrics shown in this report come from three Sia daemon APIs that sia_metrics_collector polls:
/renter/contracts/renter/files/wallet
The API latency is the total amount of time required to call these three APIs in sequence:
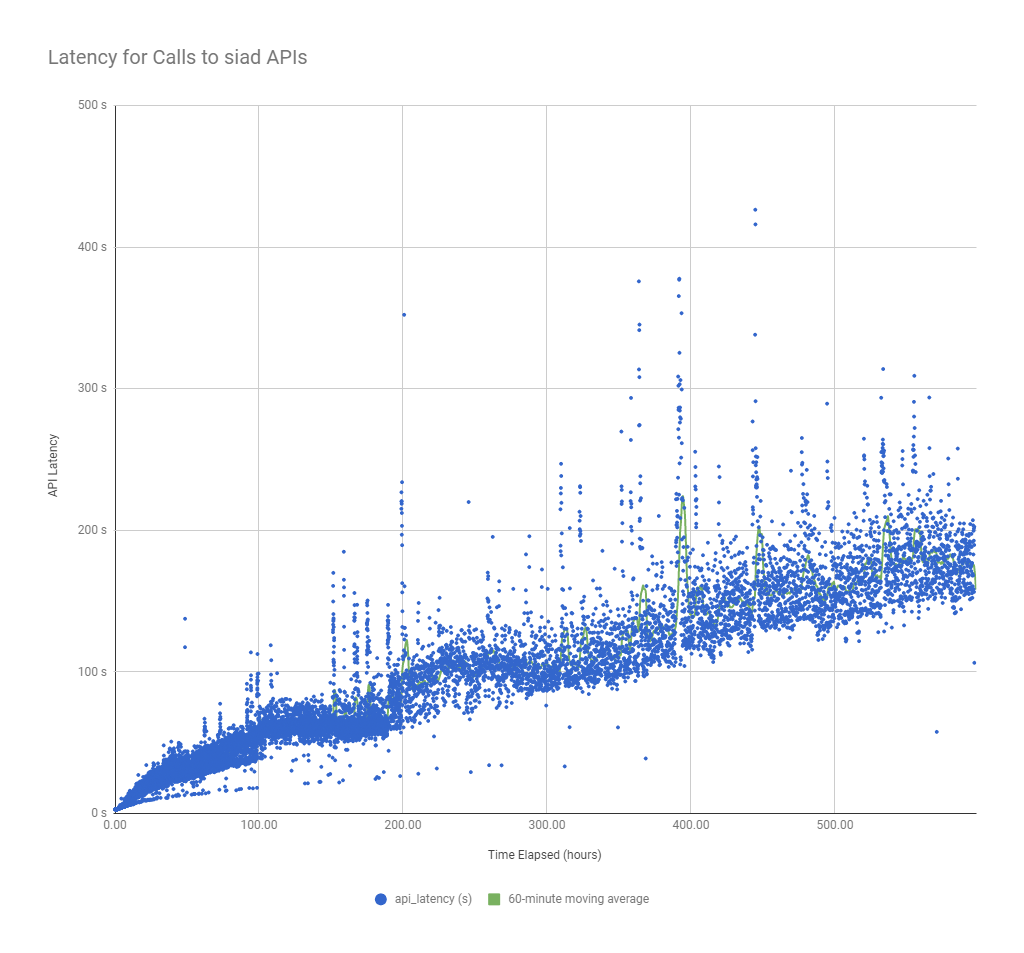
API latency is very high
Even at the beginning of the test, Sia generally took ~3 seconds to reply to all three API calls, which is very high given that it’s communication between processes on the same system. By the end, latency had increased to over 5 minutes, which is extremely high for a REST API.
High API latency decreases the accuracy of short-term bandwidth measurements
To measure bandwidth, I simply divided the change in bytes uploaded by the time between measurements. If Sia reports a 100 MB increase in data uploaded but spends five minutes gathering that information, does the reported data represent Sia’s state at the start of the 5-minute window? The end? Somewhere in between? The ambiguity here makes short-term bandwidth measurements unreliable but does not affect the accuracy of trends at the scale of hours or days.
API latency grows linearly
The graph shows clear linear growth in latency over the course of the test. It’s unclear at this point whether the increase is due to number of files, total data size, or contract duration.
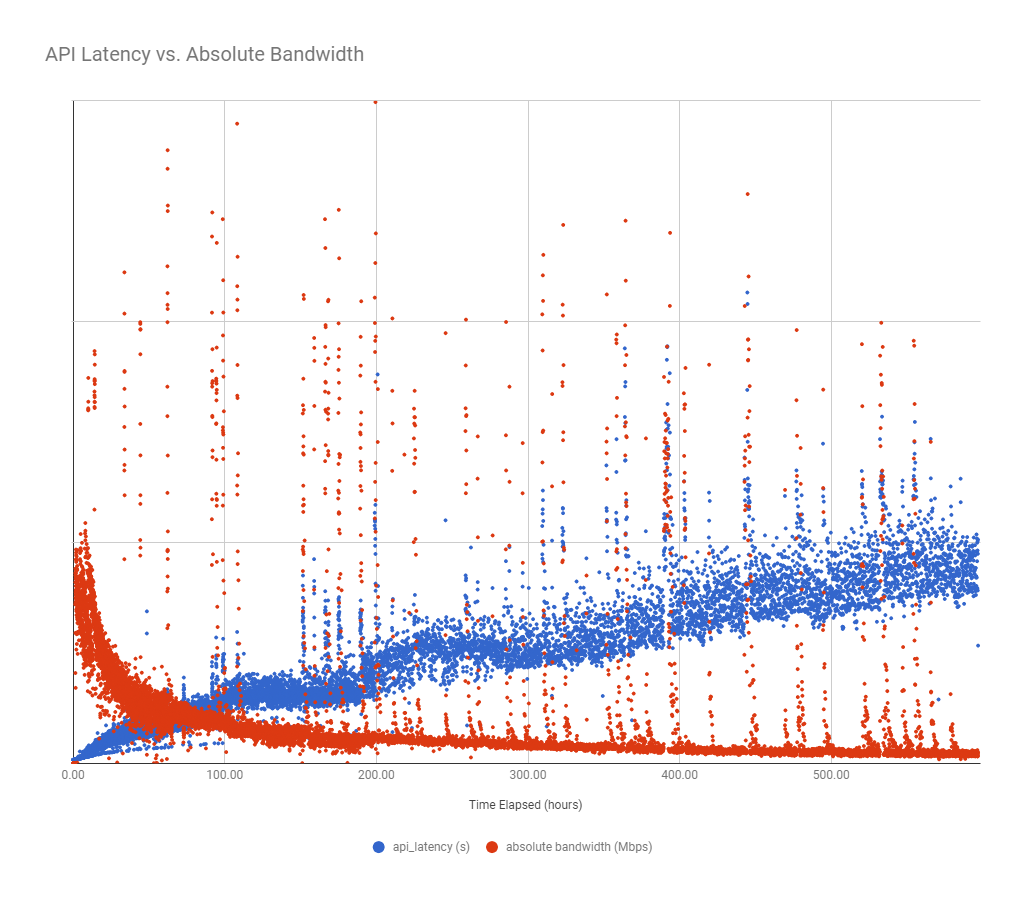
Bandwidth bursts are correlated with bursts in API latency
Interestingly, the graph shows several “bursts” of high latency. I thought at first that the high bandwidth measurements were simply a result of measurement artifacts caused by the high API latency, but the graphs of total data uploaded over time (above) seem to disprove this. Another possibility is that Sia prioritizes bandwidth above all else, so it responds more slowly to API requests because the uploader is monopolizing RAM and CPU.
Raw data
Test notes
- There were two times during the test that the metrics collector crashed, so metrics are missing for a few hours in those chunks.
- I started collecting metrics every 60 seconds, but as the API latency increased, I decreased the frequency of metrics collection more and more to a maximum of once per 5 minutes.
Reproducing results
All steps to reproduce these results are available in the sia_load_tester README.