Capturing Sia's History with Sia Metrics Collector
When I initially thought of load testing Sia, I thought I’d just watch Sia through its GUI, Sia-UI. As I started writing the test automation, I realized I wanted more insight into what Sia was doing throughout the test.
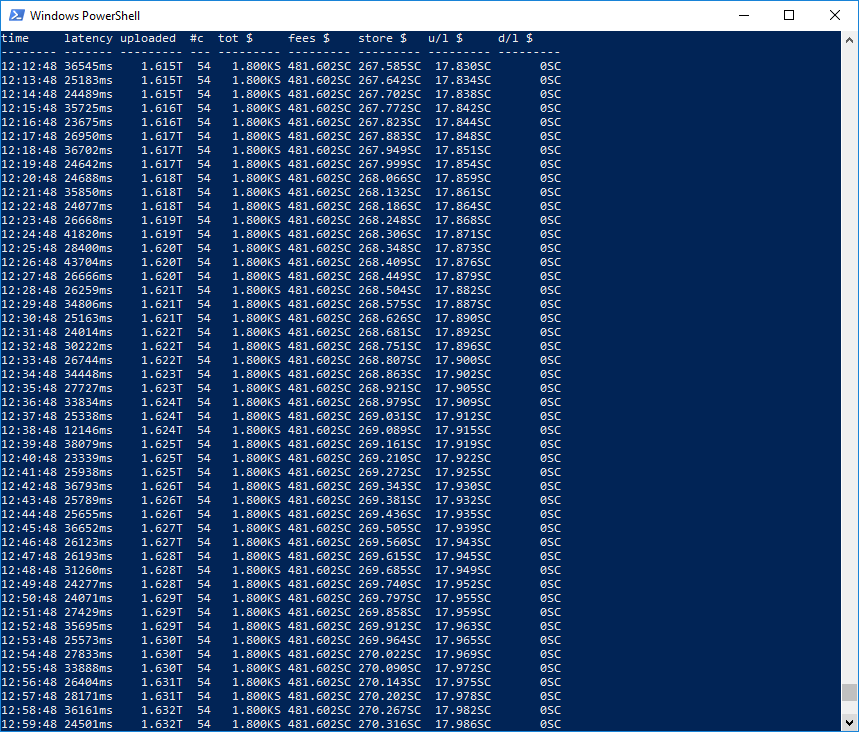
I wrote a small Python application called Sia Metrics Collector to poll Sia for relevant metrics as it runs. It dumps all the metrics to a CSV and displays a minimal subset of those metrics to the console:
Why capture metrics?
Graphs and detailed metrics make it easier to understand Sia’s behavior. If all I knew was that I started the test with 5000 SC and ended the test with zero, that would leave me with a lot of questions.
I wanted to see a graph of changes over time, like this one:
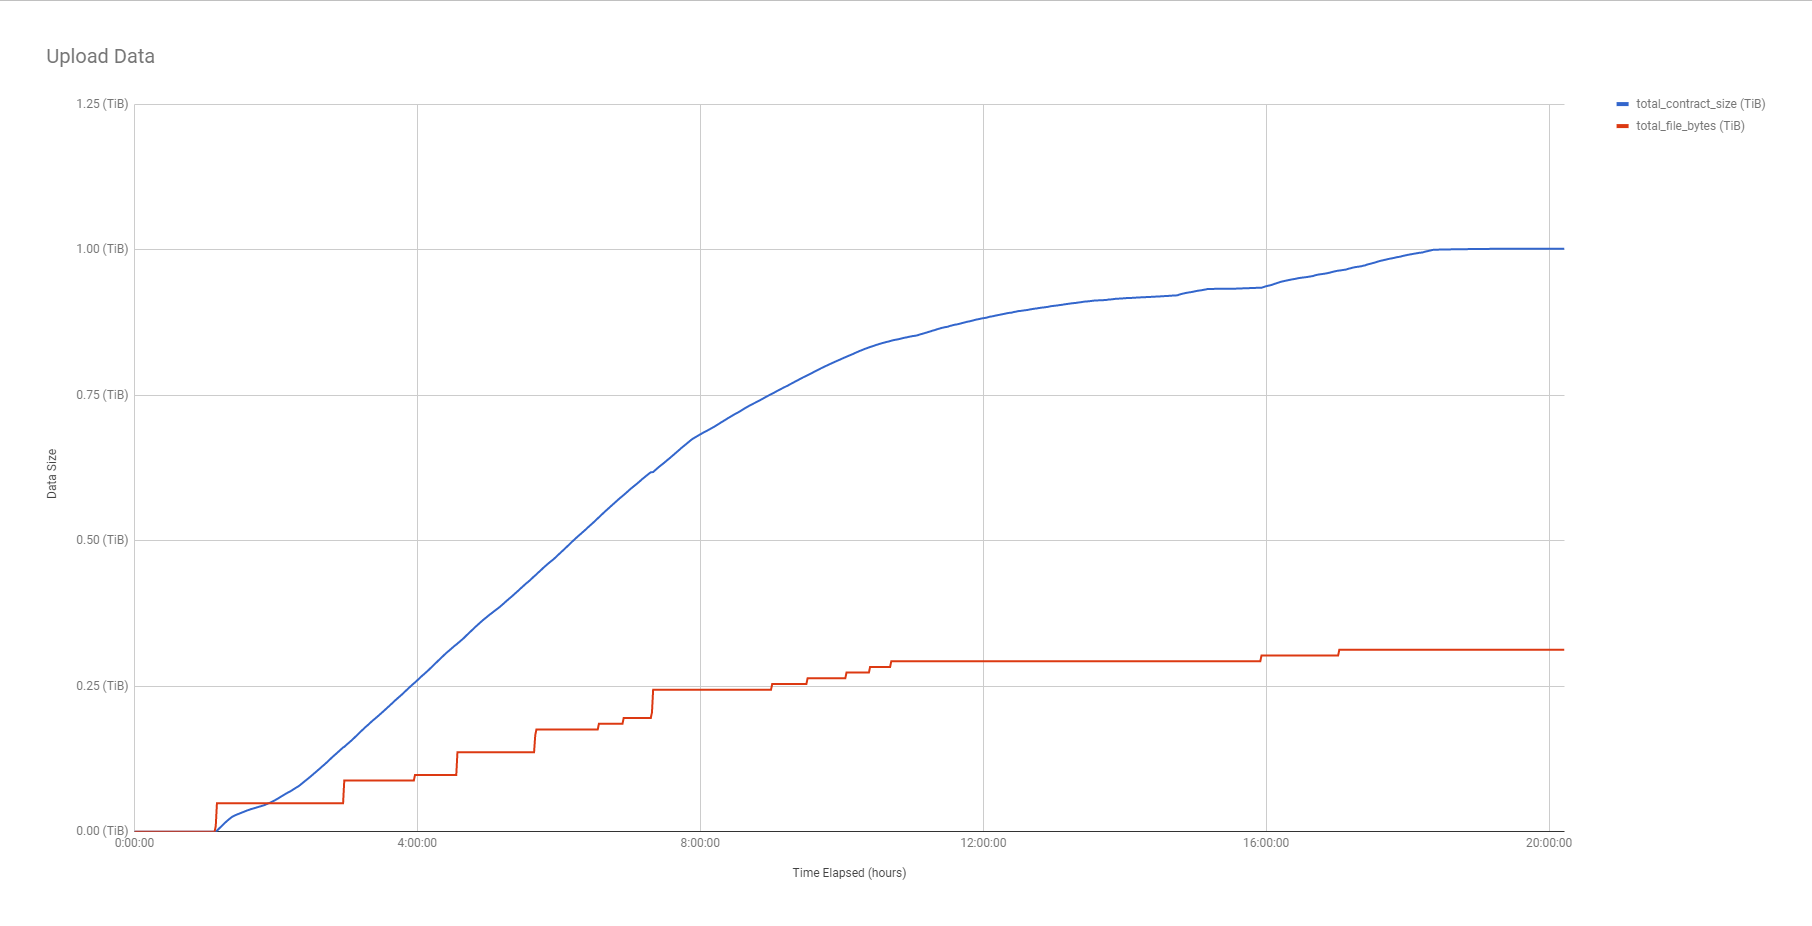
The above graph is from a real trial run of the load test using a 500 SC wallet. You see that Sia uploads data steadily for the first eight hours, then slows down until finally flatlining at ~0.3 TiB of file data uploaded, or ~1 TiB of contract usage (3x file data because of Sia’s 3x redundancy).
This is clearer in the graph of Sia’s upload bandwidth:
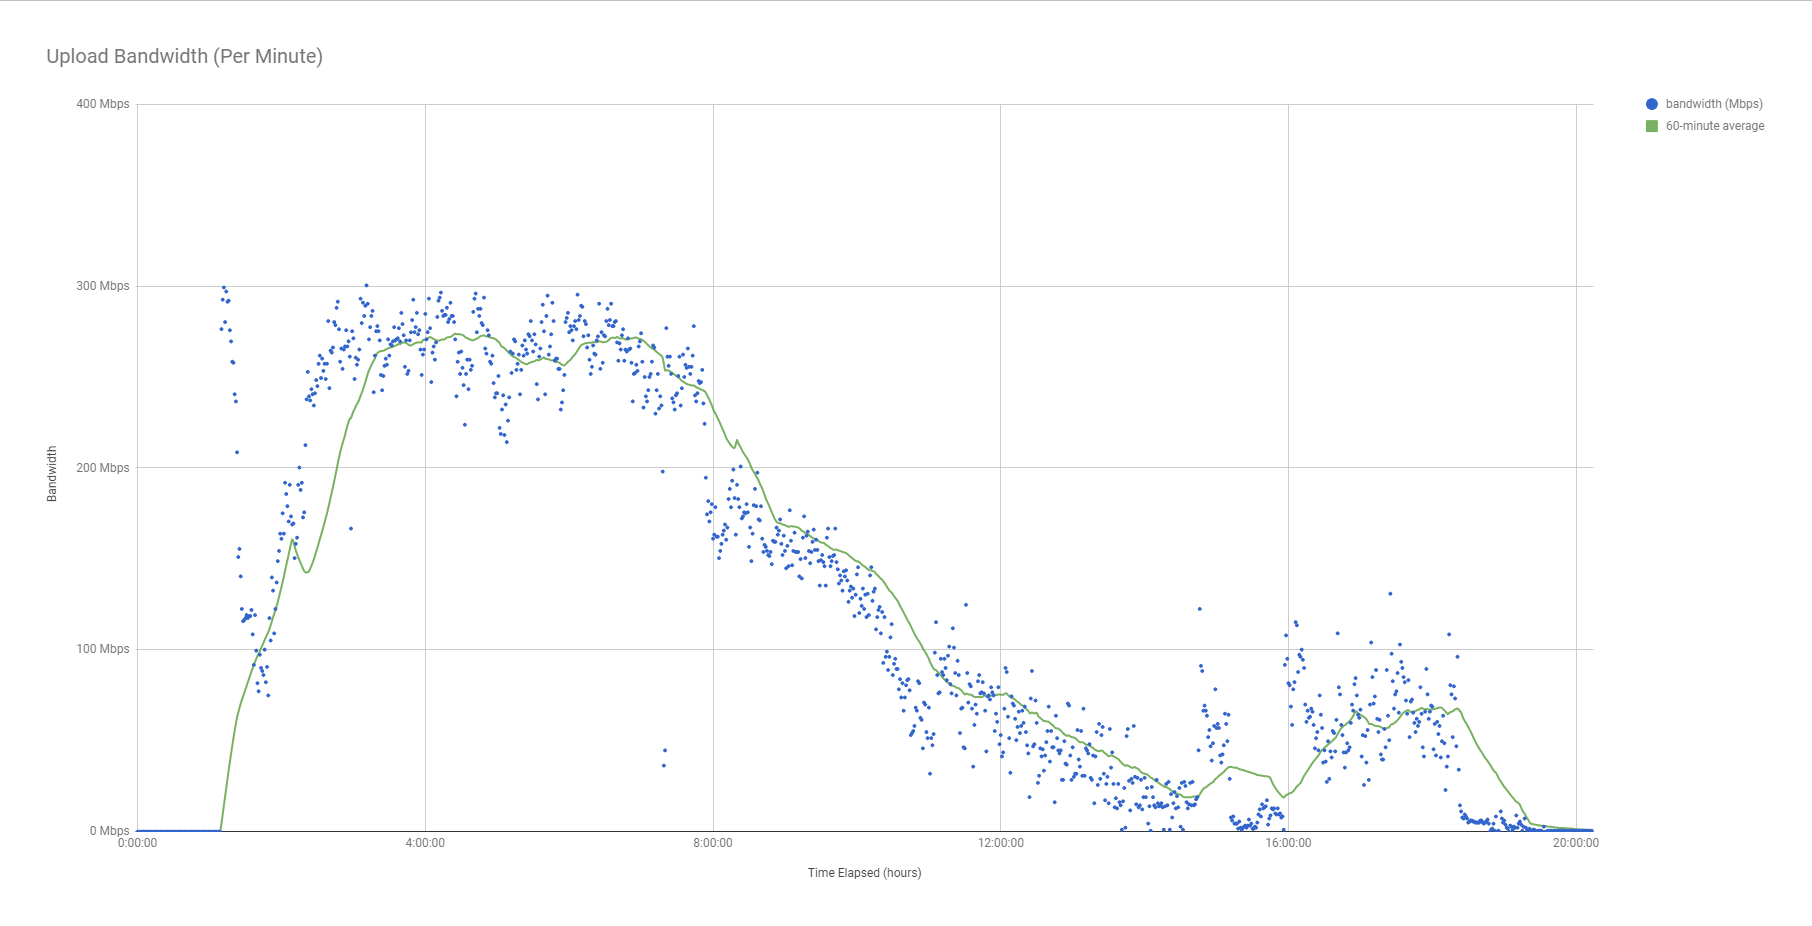
For eight hours, Sia maintained an impressively high upload bandwidth of ~250 Mbps, but rapidly declined to near zero over the next few hours.
Using Sia Metrics Collector to find bugs
The metrics collector allows me to see Sia in a new way, which also gives me an opportunity to spot unusual behavior I would never have been able to see previously. I’ve already found several Sia bugs by examining the metrics I collected in the load test trial runs.
Incorrect funds balance
When you set an allowance with Sia, it uses 1/3 of the allowance amount to purchase 50 storage contracts, spending the same amount on each contract. For example, an allowance of 500 SC causes Sia to spend 166.67 SC on 50 storage contracts, where each contract costs 3.33 SC.
As Sia purchases more contracts, it moves money from your wallet into active contracts. Therefore, the total amount of money between your wallet and contracts should remain constant for the life of the contracts.
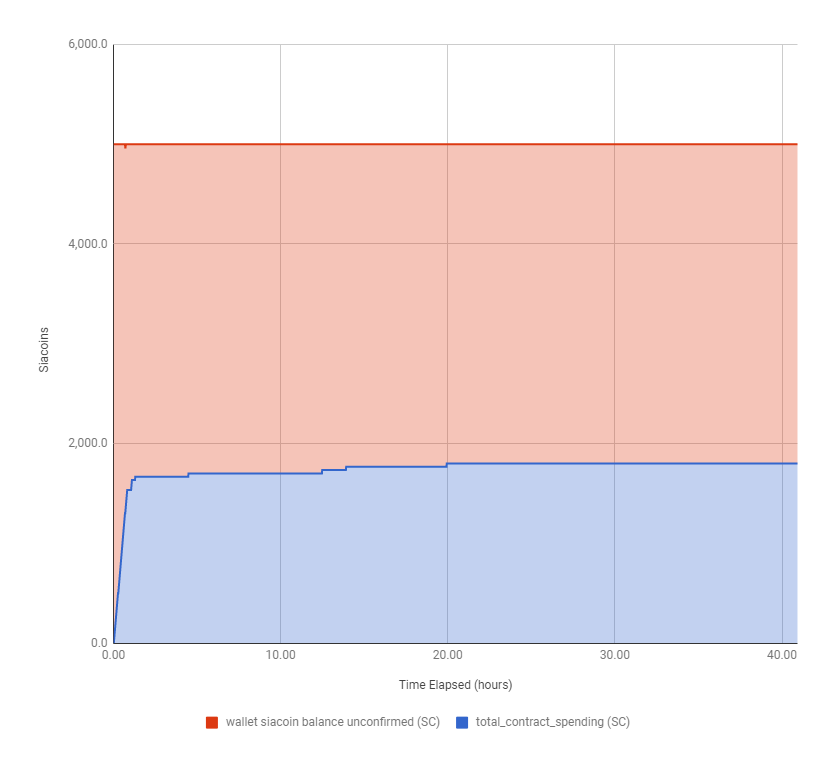
Here’s a graph that shows this on a real test with 5000 SC. The sum of wallet balance and contract spending remains 5000 SC throughout:
I tried the same test using a 500 SC wallet and saw drastically different results:
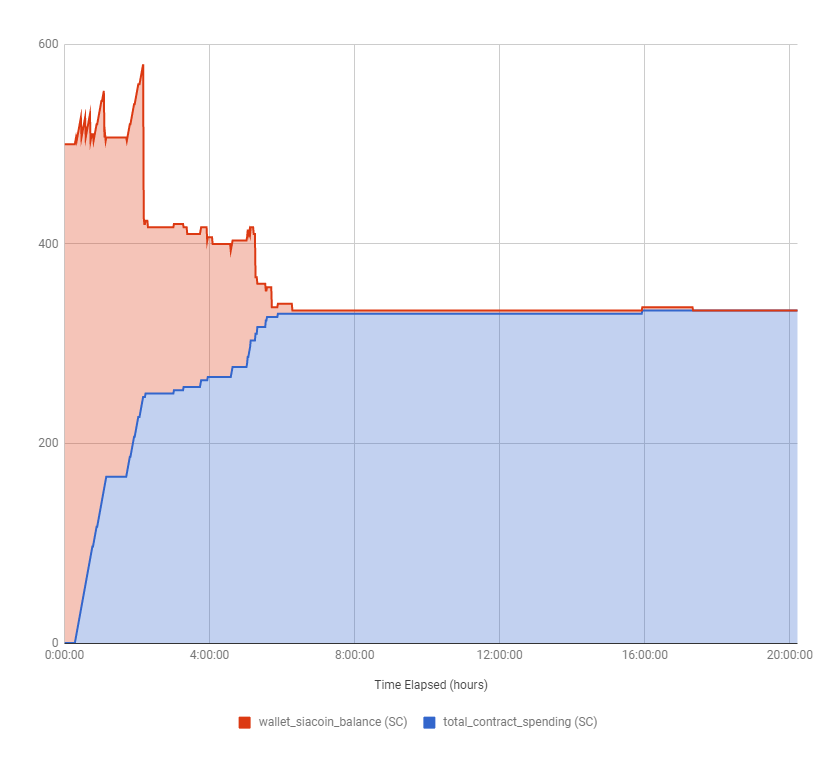
My 500 SC wallet balance dwindled down to zero, but I only ended up with 333.33 SC in storage contracts. So where’d the last 166.67 SC go?
I’ll need to dig into the wallet transaction history and file a bug with the Sia devs, but funds certainly should not disappear like this. Hopefully, it’s just a bug in Sia’s reporting and the 166.67 SC are not actually lost.
Note: The little spikes you see in the wallet balance are because the metrics collector counted unconfirmed spending on contracts, but failed to deduct it from the current wallet balance. That explains brief discrepancies that increase the total but does not explain the 166.67 SC reduction. I’ve since corrected the code to track unconfirmed wallet input and outputs.
Mysterious storage spending
I noticed odd behavior with Sia’s accounting when I examined its spending metrics. Contract costs break down into the following components:
- Storage spending
- The amount you pay to the host to keep your files for the contract period
- Upload/download spending
- The amount you pay the host for bandwidth every time you upload or download data
- Contract fees
- Frictional cost of creating storage contracts, including fees you pay to hosts, miners, and Siafund holders
If you buy a 33.3 SC storage contract, ~5.5 SC is lost to contract fees. The remaining 27.8 SC is what Sia calls “remaining renter funds.” As you perform actions on Sia, such as uploading or downloading data, Sia uses your remaining renter funds to pay the storage and bandwidth fees associated with those actions.
Sia Metrics Collector tracks all of these metrics over time. Here’s a graph of how those costs changed as my Sia node formed 50 contracts of 3.33 SC each, then began uploading data:
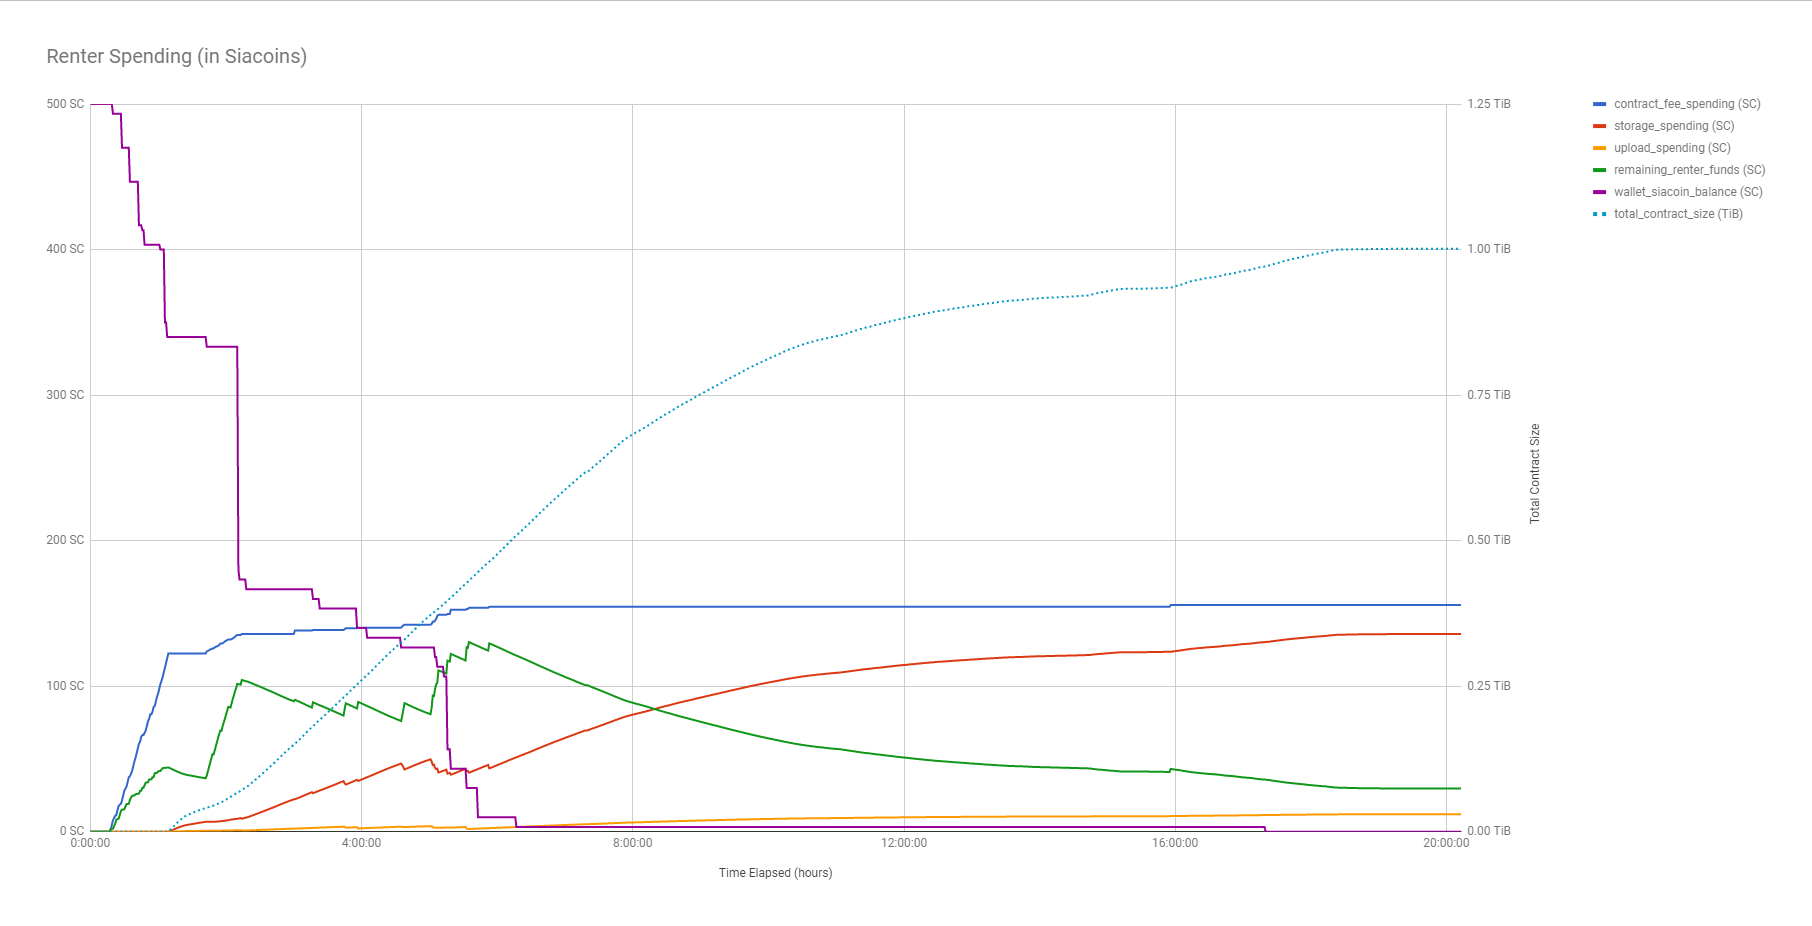
You may notice something unexpected about storage spending (the red line). I expected it to strictly increase, but there are several instances around the four-hour mark where it decreases.
This would be like pumping gas for your car and watching your the gas meter go from $19 to $20 to $21 then drop down to $19. It doesn’t make sense for aggregate spending to drop, so I filed bug #2768 with the Sia dev team to track this.
Poor contract management
The metrics revealed that Sia makes wasteful choices with contract spending. Take another look at the spending graph from above:
I wondered why remaining renter funds (the green line) sometimes increased. That metric should strictly decrease as I upload data. Instead, it shows a sawtooth pattern, alternately increasing and decreasing for the first six hours. How could I be gaining funds by uploading data?
I looked at the raw data to check more of the metrics:
| Contract Count | Total Contract Spending | Remaining Renter Funds |
| 50 | 166.67 SC | 37.00 SC |
| 50 | 166.67 SC | 36.89 SC |
| 50 | 166.67 SC | 36.77 SC |
| 50 | 170 SC | 38.59 SC |
| 50 | 173.33 SC | 41.53 SC |
| 50 | 176.67 SC | 44.48 SC |
That’s weird. Contract spending increased several times by 3.33 SC (the cost of each contract), but Sia didn’t purchase new contracts. Is it possible for Sia to increase investments in its existing contracts?
My test script dumps the state of the /renter/contracts API at the end of the test, so I decided to check the output:
$ grep totalcost 2018-02-14T185827Z-contracts.json
            "totalcost": "3333333333333333333333333",
            "totalcost": "6666666666666666666666666",
            "totalcost": "6666666666666666666666666",
            "totalcost": "3333333333333333333333333",
            ...
Yep. Sia did expand a bunch of its contracts. Many still had the original 3.33 SC, but Sia had increased the value of many contracts, some to as much as 13.33 SC.
From the renter’s perspective, this is undesirable. Buying new contracts or expanding existing ones imposes substantial frictional costs due to the contract and transaction fees. The renter only wants to add money to a contract when they have to, but the graph shows that Sia expands contracts liberally, wasting user funds in the process.
I suspect that Sia is trying to ensure that no particular contract reaches zero remaining funds. A contract with no available funds is useless because the host is storing your data, but you can’t download it. So Sia sees contracts approaching zero and adds money instead of redistributing load to unused contracts.
I filed bug #2769 to track this.
Using Sia Metrics Collector
Sia Metrics Collector is fully open-source and available on Github.
All you need to run it is a Python 2.7 environment:
# Install Sia Metrics Collector.
git clone https://github.com/mtlynch/sia_metrics_collector.git
cd sia_metrics_collector
pip install -r requirements.txt

# Begin collecting metrics.
python sia_metrics_collector\main.py \
  --poll_frequency 60 \
  --output_file "sia-metrics.csv"
You can use Google Sheets to create visualizations of the data like you see above:
- Make a copy of the template
- Import the Sia Metrics Collector’s output CSV into Google Sheets
- In the “Data - Raw” sheet of the template, paste in the data from your CSV
After pasting in your data, click the different tabs at the bottom to view the generated graphs.